- Home
- Features
- Business
- Active
- Sports
- Shop
Top Insights
AROON and Volatility Pivot Forex Trading Strategy

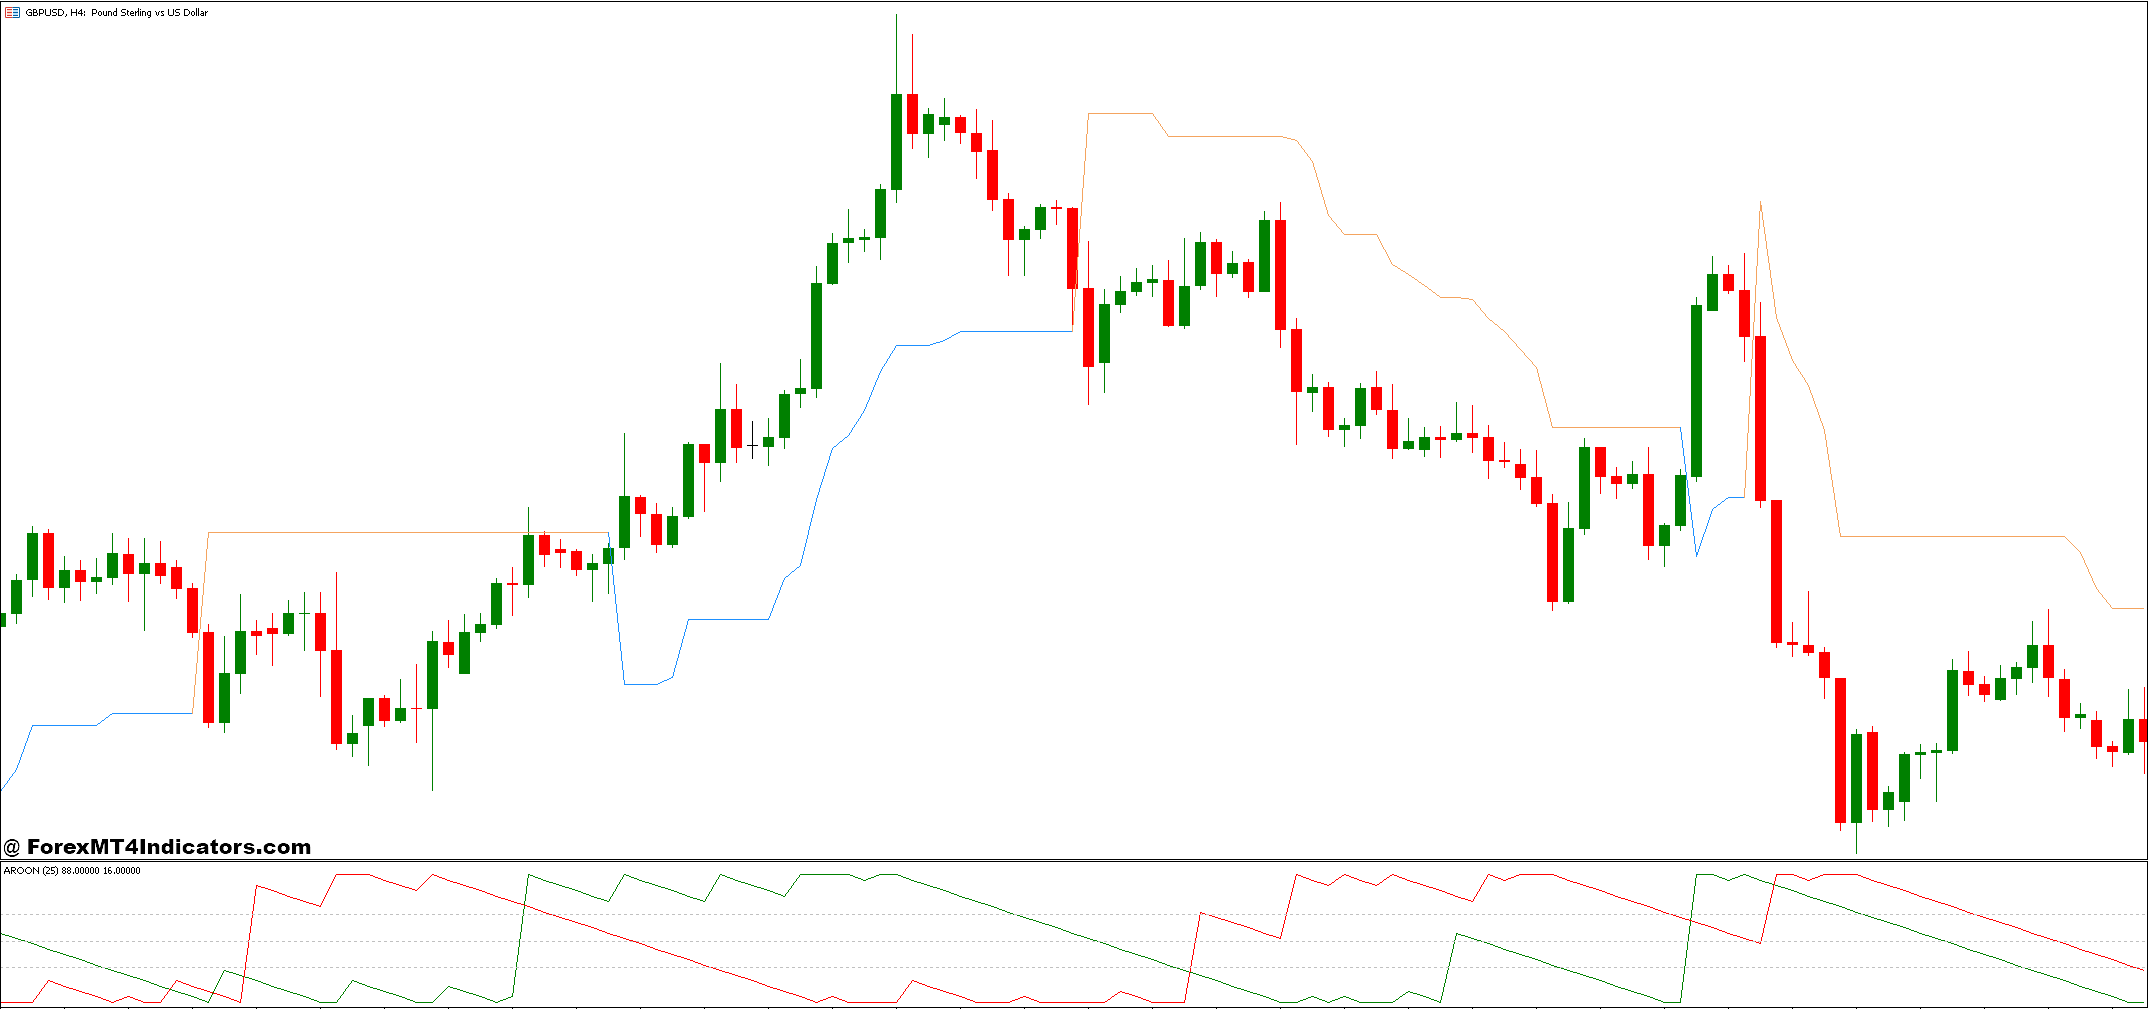
The AROON and Volatility Pivot Forex Trading Strategy combines two powerful indicators that provide traders with a clear understanding of market trends and potential price movements. The AROON indicator is a trend-following tool designed to measure the strength and direction of a trend by analyzing the time elapsed since the highest and lowest prices within a specified period. It helps traders determine whether a market is trending or moving sideways, offering valuable insights into trend reversals and confirmations. When paired with the Volatility Pivot, a tool that identifies key price levels based on market volatility, the strategy allows traders to pinpoint the most opportune moments to enter or exit trades.
The AROON indicator works by calculating two lines: AROON Up and AROON Down. These lines represent the strength of the uptrend and downtrend, respectively, and their positioning relative to each other helps traders identify the market’s trend direction. When the AROON Up line is above the AROON Down line, it signals an uptrend, and when the AROON Down line is higher, it suggests a downtrend. This simplicity makes the AROON indicator a favorite among traders who are looking to catch trends early. However, the true power of this strategy emerges when AROON is used in conjunction with the Volatility Pivot indicator, which provides additional layers of analysis based on market fluctuations.
The Volatility Pivot identifies critical price levels that act as support or resistance, adjusting dynamically according to market volatility. Unlike traditional static pivots, the Volatility Pivot levels adapt to the changing market conditions, making them more accurate for predicting breakout points or price reversals. This makes the Volatility Pivot a valuable tool for traders who need to assess market conditions with greater precision. When combined with the AROON indicator, the AROON and Volatility Pivot Forex Trading Strategy helps traders filter out false signals, providing a comprehensive approach to identifying potential profitable trades. This strategy not only helps traders stay in tune with the prevailing trend but also provides them with the flexibility to manage volatility, ultimately enhancing their decision-making process in the Forex market.
The AROON Indicator
The AROON Indicator is a trend-following tool that was developed by Tushar Chande in 1995 to identify the presence and strength of trends in the market. It is particularly useful in detecting trend reversals or shifts before they become apparent on other indicators. The AROON indicator consists of two lines: AROON Up and AROON Down. These lines measure the time it has taken for the highest and lowest prices to occur over a set period, usually 14 periods. The basic idea is that if a trend is strong, the highest or lowest price will have occurred recently.
- AROON Up tracks the number of periods since the highest price occurred during the specified period, with a value between 0 and 100. A value of 100 indicates that the highest price has occurred in the most recent period, signaling a strong uptrend.
- AROON Down measures the number of periods since the lowest price occurred within the same timeframe. A reading of 100 indicates a strong downtrend, while a value of 0 suggests that the market is moving upward.
Traders use the AROON indicator to identify whether the market is trending or ranging. When the AROON Up line is above the AROON Down line, it signals an uptrend, and when the AROON Down line is higher, it suggests a downtrend. The strength of these trends is gauged by how far apart the AROON lines are. The closer they are, the weaker the trend, and the farther apart they are, the stronger the trend. A crossing of the AROON Up and AROON Down lines can also signal a potential reversal or trend shift, offering traders key entry or exit points.
The AROON Indicator is effective in trending markets and can help traders stay in the market for longer periods, capturing substantial price moves. However, it’s most effective when combined with other tools, such as the Volatility Pivot Indicator, to help confirm trends and price action.
The Volatility Pivot Indicator
The Volatility Pivot Indicator is a unique tool that helps traders identify critical price levels based on market volatility rather than just traditional support and resistance. Unlike standard pivot points that rely on previous price highs, lows, and closes, the Volatility Pivot adjusts its levels dynamically according to the volatility of the market. It offers a more accurate representation of where price action is likely to encounter resistance or support, which can be particularly useful in fast-moving markets or during periods of high volatility.
The key idea behind the Volatility Pivot is that the market’s price movement can often be more influenced by volatility than by traditional levels of support and resistance. The indicator calculates pivot points based on a combination of the average true range (ATR) and volatility metrics. The result is a set of levels that change in response to the market’s behavior, allowing traders to adapt to different market conditions. These levels act as zones where price may struggle to move beyond or where a breakout might occur, providing traders with actionable insights for their trades.
Traders use the Volatility Pivot Indicator to determine areas of potential price reversals or breakouts. If the price approaches a volatility pivot level and fails to break through, it could signal a reversal or consolidation. On the other hand, if the price breaks through the pivot level with strong momentum, it can indicate a potential breakout and the continuation of the trend. By using the Volatility Pivot Indicator in conjunction with other trend-following tools like the AROON indicator, traders can significantly enhance their ability to navigate volatile market conditions and make more informed trading decisions.
The Volatility Pivot Indicator is especially valuable in markets that experience frequent price fluctuations or during periods of uncertainty, offering a flexible and adaptive approach to price action. When combined with the AROON Indicator, it can help traders not only confirm trends but also fine-tune their entry and exit points by considering both trend strength and market volatility.
How to Trade with AROON and Volatility Pivot Forex Trading Strategy
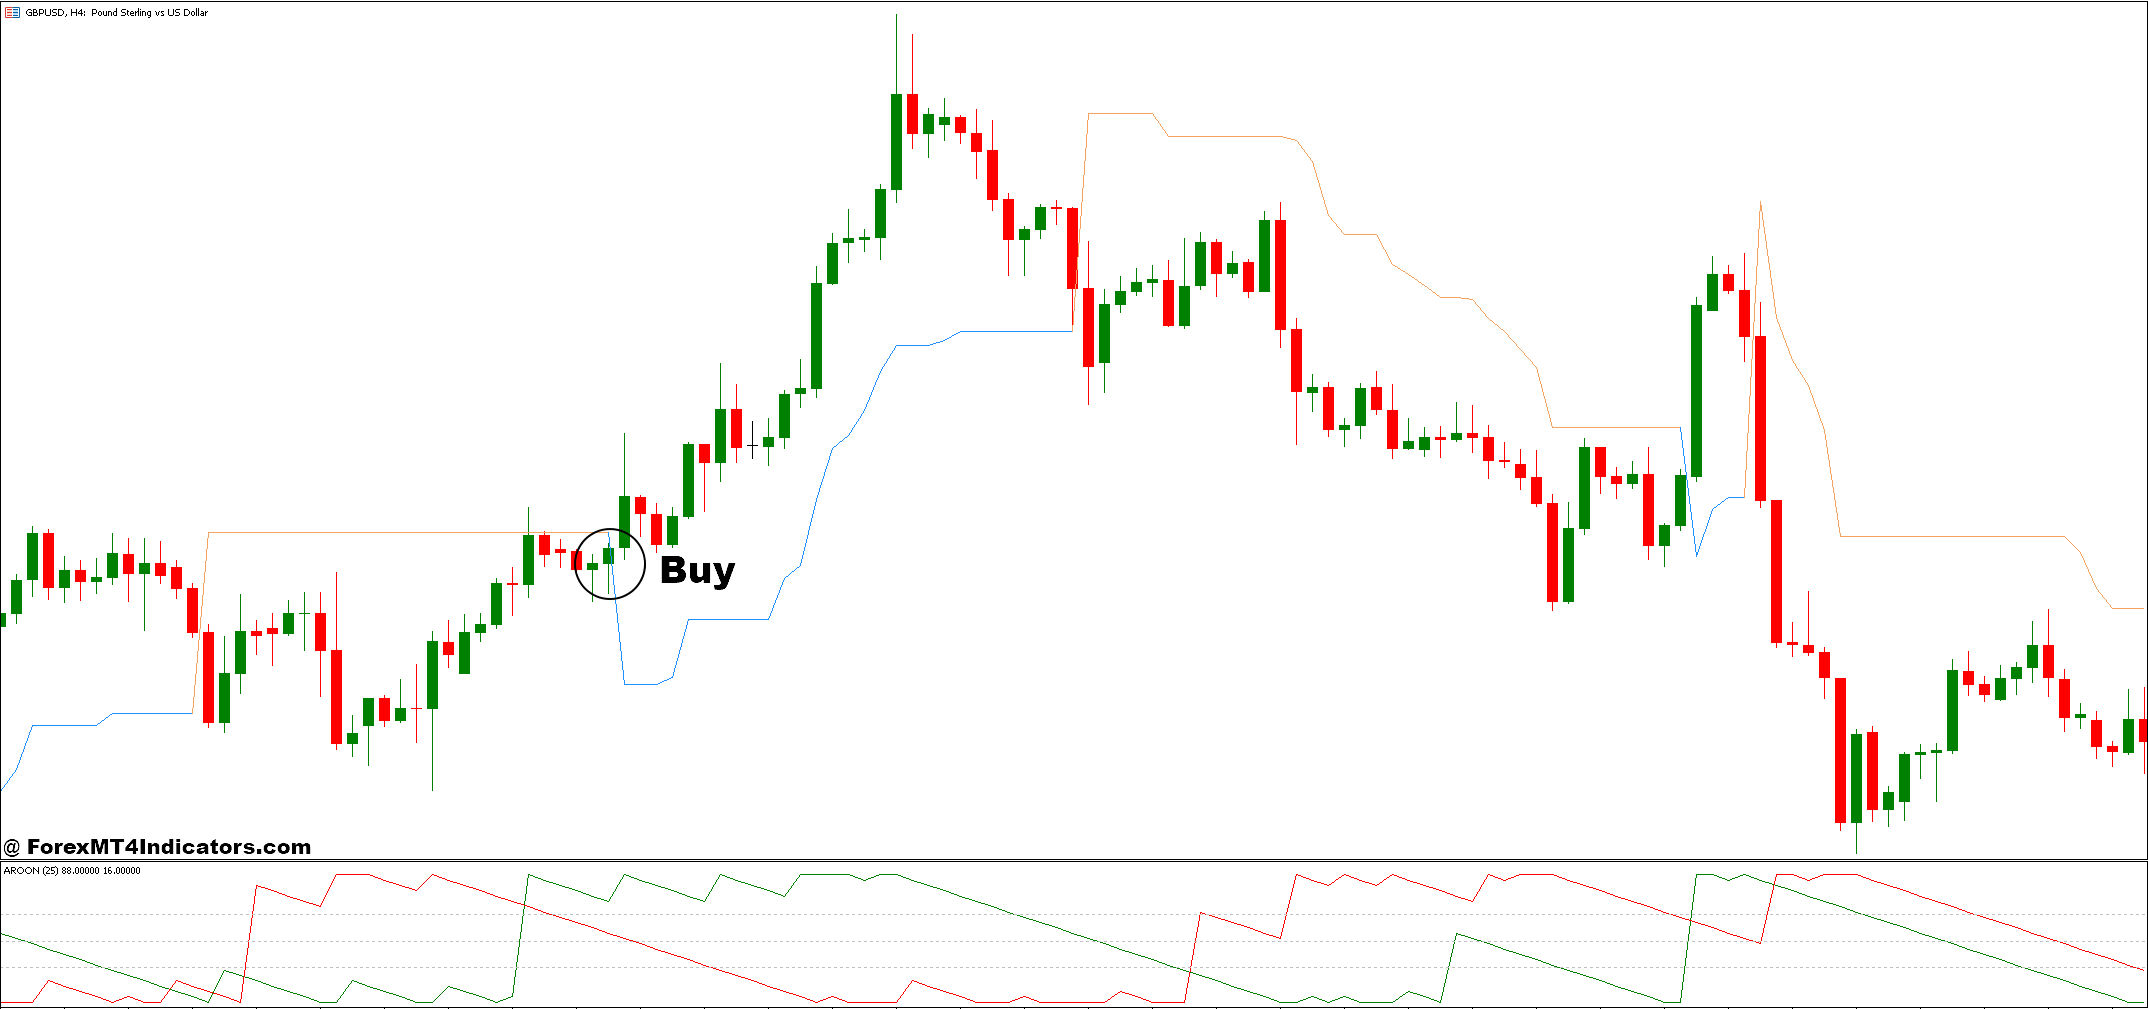
Buy Entry
- AROON Up line is above the AROON Down line, indicating an uptrend.
- AROON Up is above 50, suggesting a strong uptrend.
- Price approaches a volatility pivot support level.
- Look for price to bounce off this support level.
- Watch for a bullish candlestick reversal pattern (e.g., bullish engulfing, hammer, or morning star) at the support level to confirm the continuation of the uptrend.
- Place stop loss just below the recent volatility pivot support level or swing low.
- Set take profit at the next volatility pivot resistance level or a predefined risk-reward ratio.
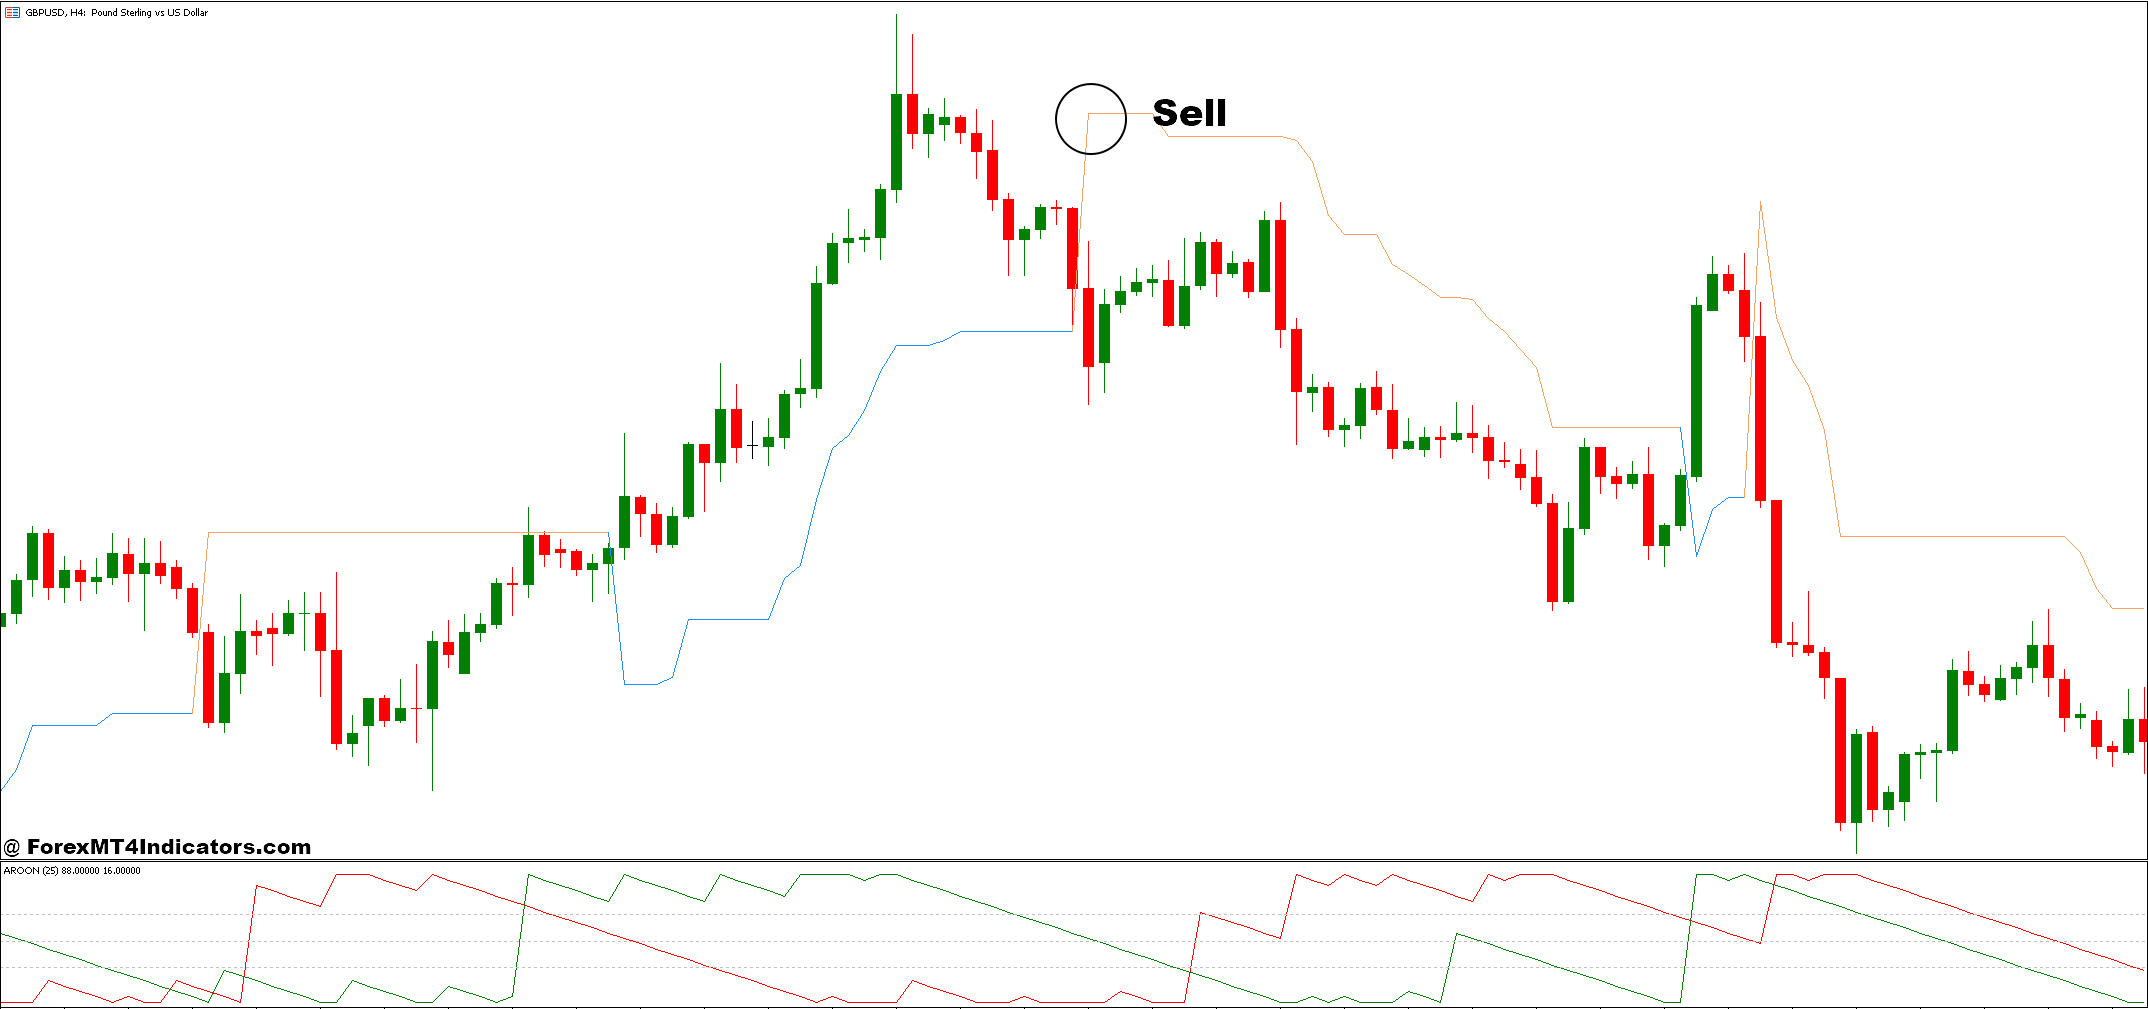
Sell Entry
- AROON Down line is above the AROON Up line, indicating a downtrend.
- AROON Down is above 50, suggesting a strong downtrend.
- Price approaches a volatility pivot resistance level.
- Look for price to struggle to break through this resistance level and show signs of reversal.
- Watch for a bearish candlestick reversal pattern (e.g., shooting star, bearish engulfing, or evening star) at the resistance level to confirm the continuation of the downtrend.
- Place stop loss just above the recent volatility pivot resistance level or swing high.
- Set take profit at the next volatility pivot support level or a predefined risk-reward ratio.
Conclusion
The AROON and Volatility Pivot Forex Trading Strategy offers traders a dynamic and effective approach to navigating the markets by combining trend analysis with adaptive price levels. The AROON indicator helps identify the strength and direction of the trend, while the Volatility Pivot indicator provides crucial support and resistance levels based on market volatility, enabling traders to make more informed decisions.
Recommended MT4 Broker
XM Broker
- Free $50 To Start Trading Instantly! (Withdraw-able Profit)
- Deposit Bonus up to $5,000
- Unlimited Loyalty Program
- Award Winning Forex Broker
- Additional Exclusive Bonuses Throughout The Year
- Exclusive 50% Cash Rebates for all Trades!
Already an XM client but missing out on cashback? Open New Real Account and Enter this Partner Code: 𝟕𝐖𝟑𝐉𝐐
Click here below to download:
Save
Save
Recent Posts
Categories
Related Articles
Forexlive Americas FX news wrap 3 Jan:December ISM PMI rises. Stocks snap losing streaks
Major US indices snap losing streaksFed Kugler: Economy ended 2024 in a...
ByglobalreutersJanuary 3, 2025Major US indices snap losing streaks
Major US indices are closing solidly higher and in doing so are...
ByglobalreutersJanuary 3, 2025Fed Kugler: Economy ended 2024 in a good place. The economy is resilient
Fed's Kugler is on CNBC and says: US economy ended 2024 in...
ByglobalreutersJanuary 3, 2025Judge orders Trump to appear for sentencing on January 10 in hush money criminal case
Well this is very interesting.A judge denied a bid to dismiss the...
ByglobalreutersJanuary 3, 2025


Leave a comment