


Bitcoin Price Hints At Potential Correction, Buy The Dip?

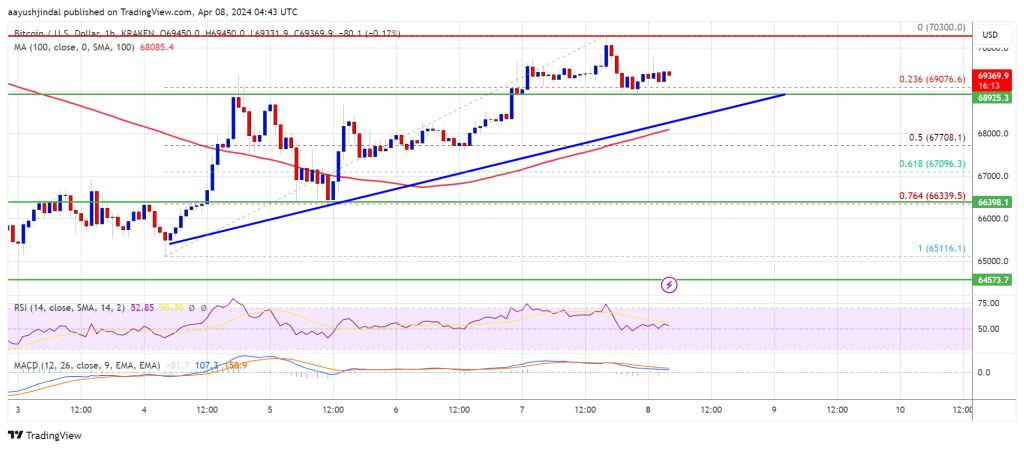
Bitcoin price is showing a few positive signs above the $68,500 resistance. BTC must settle above the $70,000 resistance to continue higher in the near term.
- Bitcoin is eyeing a steady increase above $69,500 and $70,000 levels.
- The price is trading above $68,000 and the 100 hourly Simple moving average.
- There is a key bullish trend line forming with support near $68,800 on the hourly chart of the BTC/USD pair (data feed from Kraken).
- The pair could start another increase if it stays above the $68,000 support zone.
Bitcoin Price Holds Support
Bitcoin price started a decent increase above the $67,500 resistance zone. BTC cleared the $68,500 and $68,800 resistance levels to move into a positive zone.
The price even spiked above the $70,000 resistance zone. A high was formed near the $70,300 level and the price is now correcting gains. There was a move below the $70,000 level. There was a move below the 23.6% Fib retracement level of the upward move from the $65,116 swing low to the $70,300 high.
Bitcoin is now trading above $68,000 and the 100 hourly Simple moving average. Immediate resistance is near the $69,800 level. The first major resistance could be $70,000.
Source: BTCUSD on TradingView.com
The next resistance now sits at $70,300. If there is a clear move above the $70,300 resistance zone, the price could start a fresh increase. In the stated case, the price could rise toward $71,200. The next major resistance is near the $72,000 zone. Any more gains might send Bitcoin toward the $73,500 resistance zone in the near term.
Are Dips Limited In BTC?
If Bitcoin fails to rise above the $70,000 resistance zone, it could start a downside correction. Immediate support on the downside is near the $69,000 level or the trend line.
The first major support is $67,800 or the 50% Fib retracement level of the upward move from the $65,116 swing low to the $70,300 high. The next support sits at $66,500. If there is a close below $66,500, the price could start a drop toward the $65,350 level. Any more losses might send the price toward the $62,500 support zone in the near term.
Technical indicators:
Hourly MACD – The MACD is now losing pace in the bullish zone.
Hourly RSI (Relative Strength Index) – The RSI for BTC/USD is now near the 50 level.
Major Support Levels – $68,800, followed by $67,800.
Major Resistance Levels – $69,800, $70,000, and $71,200.
Related Articles

From Vesting Plans to Binance Wallets: A Deep Dive into TRUMP Token’s Distribution
More than a month after Donald Trump, the 47th U.S. president, launched...
North Korea’s Lazarus Group now using crypto gifts to breach security defenses
The North Korean-linked Lazarus Group has adopted a new method of breaching...
Bybit crypto exchange hit by the largest theft of any kind, ever
It was a tough day in the market but that's nothing compared...
The Leading Crypto to Buy Before March? Analysts Say This Altcoin Could Lead the Market
Discover why RCO Finance (RCOF) is the best crypto to buy before...
Leave a comment