- Home
- Features
- Business
- Active
- Sports
- Shop
Top Insights
Bitcoin Price Slide: Extends Losses Amid Increased Selling Pressure

Bitcoin price extended its losses and traded below the $65,000 level. BTC is showing bearish signs and might extend losses below the $64,600 level.
- Bitcoin remained in a bearish zone and traded below $65,000.
- The price is trading below $66,000 and the 100 hourly Simple moving average.
- There is a connecting trend line forming with resistance at $67,500 on the hourly chart of the BTC/USD pair (data feed from Kraken).
- The pair could continue to move down and even trade below the $64,500 support zone.
Bitcoin Price Extends Its Decline
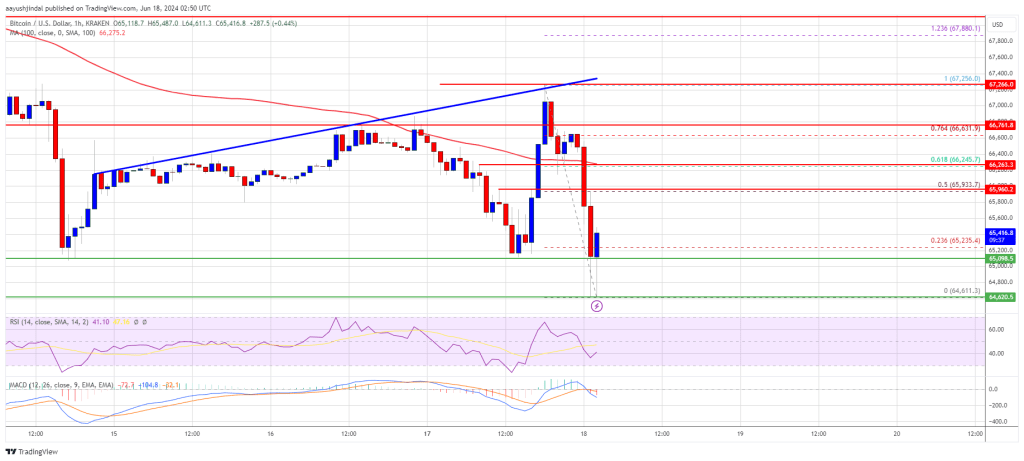
Bitcoin price struggled to recover above the $66,500 resistance zone. BTC remained in a bearish zone and started a fresh decline from the $67,256 high. There was a move below the $66,500 level.
There was a clear move below the $65,500 and $65,000 support levels. Finally, the price tested $64,600. A low was formed at $64,611 and the price is now consolidating losses. There was a minor increase above the $65,000 level. The price climbed above the 23.6% Fib retracement level of the downward move from the $67,256 swing high to the $64,611 low.
Bitcoin is now trading below $66,000 and the 100 hourly Simple moving average. There is also a connecting trend line forming with resistance at $67,500 on the hourly chart of the BTC/USD pair.
On the upside, the price is facing resistance near the $66,000 level or the 50% Fib retracement level of the downward move from the $67,256 swing high to the $64,611 low. The first major resistance could be $66,250. The next key resistance could be $66,500.
A clear move above the $66,500 resistance might start a decent increase and send the price higher. In the stated case, the price could rise and test the $67,500 resistance. Any more gains might send BTC toward the $68,500 resistance in the near term.
More Losses In BTC?
If Bitcoin fails to climb above the $66,000 resistance zone, it could continue to move down. Immediate support on the downside is near the $65,000 level.
The first major support is $64,600. The next support is now forming near $64,500. Any more losses might send the price toward the $63,200 support zone in the near term.
Technical indicators:
Hourly MACD – The MACD is now gaining pace in the bearish zone.
Hourly RSI (Relative Strength Index) – The RSI for BTC/USD is now below the 50 level.
Major Support Levels – $65,000, followed by $64,500.
Major Resistance Levels – $66,000, and $66,500.
Recent Posts
Categories
Related Articles
Robert Kiyosaki: Missing Fort Knox Gold Would Unleash World Chaos, Collapse Economy, Crash US Dollar
Robert Kiyosaki warned that if Fort Knox gold is missing, the U.S....
ByglobalreutersFebruary 24, 2025dYdX CEO Predicts a Long DeFi Boom Starting in September
Charles d’Haussy, CEO of the dYdX Foundation, expects a major DeFi boom...
ByglobalreutersFebruary 23, 20254 reasons why soaring Mantra price may crash soon
Mantra price has gone parabolic since 2024, becoming one of the best-performing...
ByglobalreutersFebruary 23, 2025Shiba Inu Whale Activity Plunges 79% In Three Months — What’s Happening?
The meme coin market has seen a remarkable transformation in the past...
ByglobalreutersFebruary 23, 2025


Leave a comment