- Home
- Features
- Business
- Active
- Sports
- Shop
Top Insights

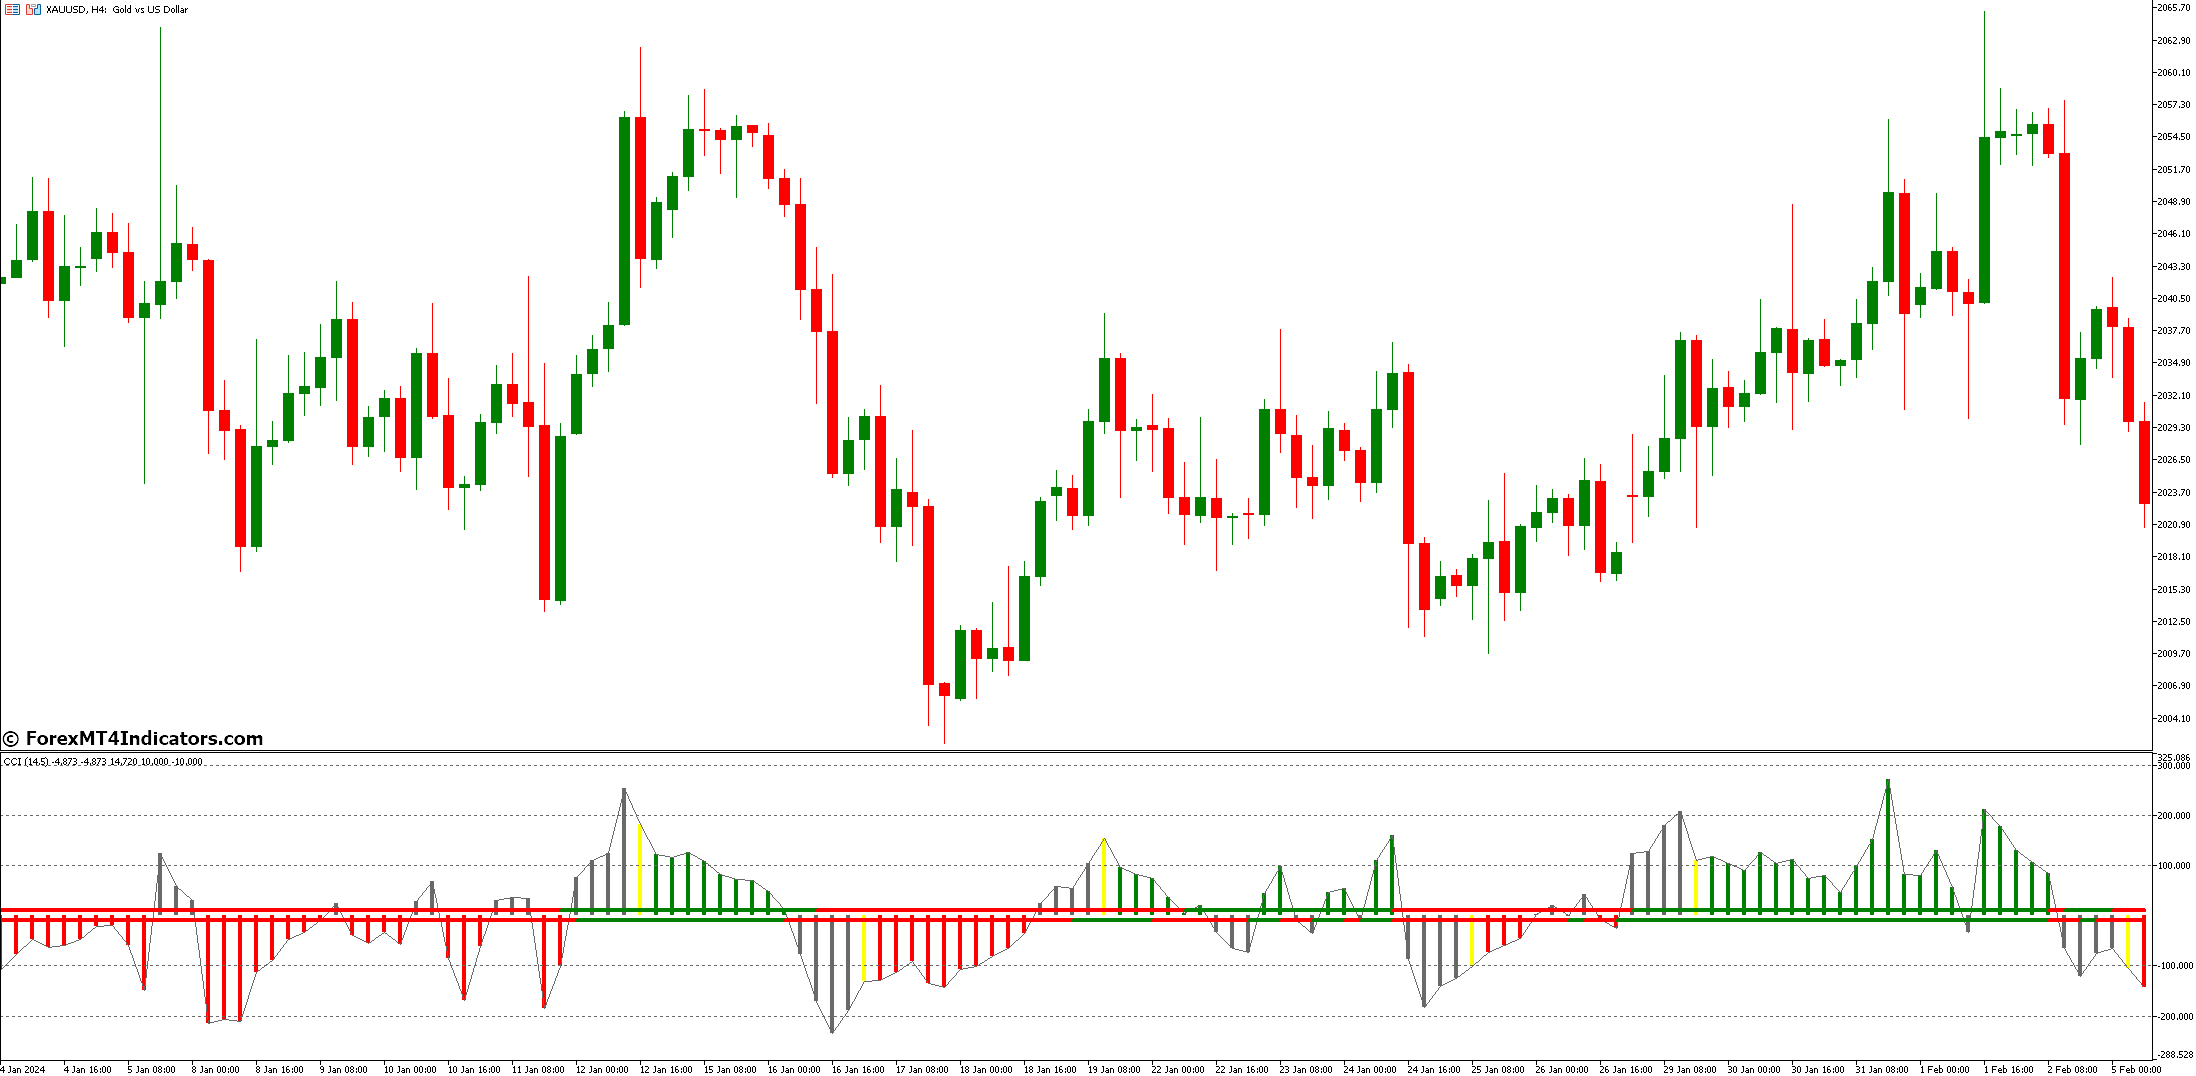
The CCI Woodies Indicator draws its power from the underlying CCI. Introduced by esteemed technician Donald Lambert, the CCI measures the current price level relative to its average historical price range. Think of it as a gauge that indicates how “stretched” prices are from their typical behavior.
Here’s a breakdown of the CCI’s core functionalities:
- Price Deviation: The CCI calculates the difference between the current price and its historical moving average. This deviation is then statistically normalized to account for market volatility.
- Overbought/Oversold Levels: Traditionally, CCI readings above +100 are considered overbought zones, suggesting a potential price correction. Conversely, readings below -100 signify oversold territories, hinting at a possible price rebound.
- Cyclical Indicator: Unlike absolute trend indicators, the CCI oscillates above and below the zero line, reflecting the cyclical nature of price movements.
Now that we’ve grasped the essence of the CCI, let’s see how the CCI Woodies Indicator builds upon this foundation.
Strategies With the Cci Woodies Indicator
The beauty of the CCI Woodies Indicator lies in its versatility. It empowers you to identify potential entry and exit points based on various trading strategies. Here are a few popular approaches:
- Zero Line Rejections: A price reversal candlestick pattern, like a hammer or engulfing bar, occurring near the zero line can signal a potential trend change. If the price bounces off the zero line after dipping below it (indicating oversold conditions), it might suggest a bullish reversal. Conversely, a rejection at the zero line after reaching overbought territory could hint at a bearish reversal.
- Breakouts and Breakdowns: When the price breaks decisively above a resistance level with a concurrent bullish CCI signal (e.g., the indicator line crossing above the zero line), it might suggest a potential buying opportunity. Conversely, a price breakdown below a support level accompanied by a bearish CCI signal (e.g., the indicator line dipping below the zero line) could indicate a potential selling opportunity.
Elevate Your Trading Game
The CCI Woodies Indicator is a powerful tool, but its true potential unfolds when combined with other technical analysis strategies and a nuanced understanding of market conditions. Here are some ways to elevate your trading game:
- Merging with Other Tools: The CCI Woodies Indicator shines brightest when it plays alongside other technical analysis instruments. For instance, using moving averages can help confirm trend direction. A price breakout above a resistance level coinciding with a bullish CCI signal and a rising moving average strengthens the potential for a continued uptrend.
- Adapting to Market Conditions: The CCI Woodies Indicator can be adapted for various market environments. In trending markets, the focus might be on identifying breakouts and breakdowns aligned with the overall trend direction. Conversely, during range-bound markets, the emphasis might shift to identifying overbought/oversold signals using the CCI readings in conjunction with price behavior near support and resistance levels.
- Backtesting with Historical Data: Before deploying any strategy live, backtesting it on historical data is crucial. This allows you to assess the strategy’s effectiveness in different market conditions and refine your approach. The MT5 platform itself offers backtesting functionalities, allowing you to test your CCI Woodies-based strategies on past price data and analyze their performance metrics.
Advantages and Limitations of the Cci Woodies Indicator
No technical analysis tool is a magic bullet, and the CCI Woodies Indicator is no exception. Let’s delve into its strengths and weaknesses to help you make informed decisions.
Advantages
- Simplicity: The visual representation of the CCI readings makes it user-friendly, even for novice traders.
- Adaptability: The indicator can be used for various trading strategies and market conditions.
- Early Warning Signs: The CCI can provide early indications of potential trend reversals or overbought/oversold conditions.
Limitations
- False Signals: Like any technical indicator, the CCI Woodies Indicator can generate false signals, especially during periods of high market volatility.
- Confirmation Bias: Traders might subconsciously interpret price movements to fit their expectations based on the indicator’s readings. Always prioritize confirmation from other technical analysis tools and price action.
- Not a Standalone Tool: The CCI Woodies Indicator is best used in conjunction with other trading strategies and risk management practices.
How to Trade with CCI Woodies MT5 Indicator
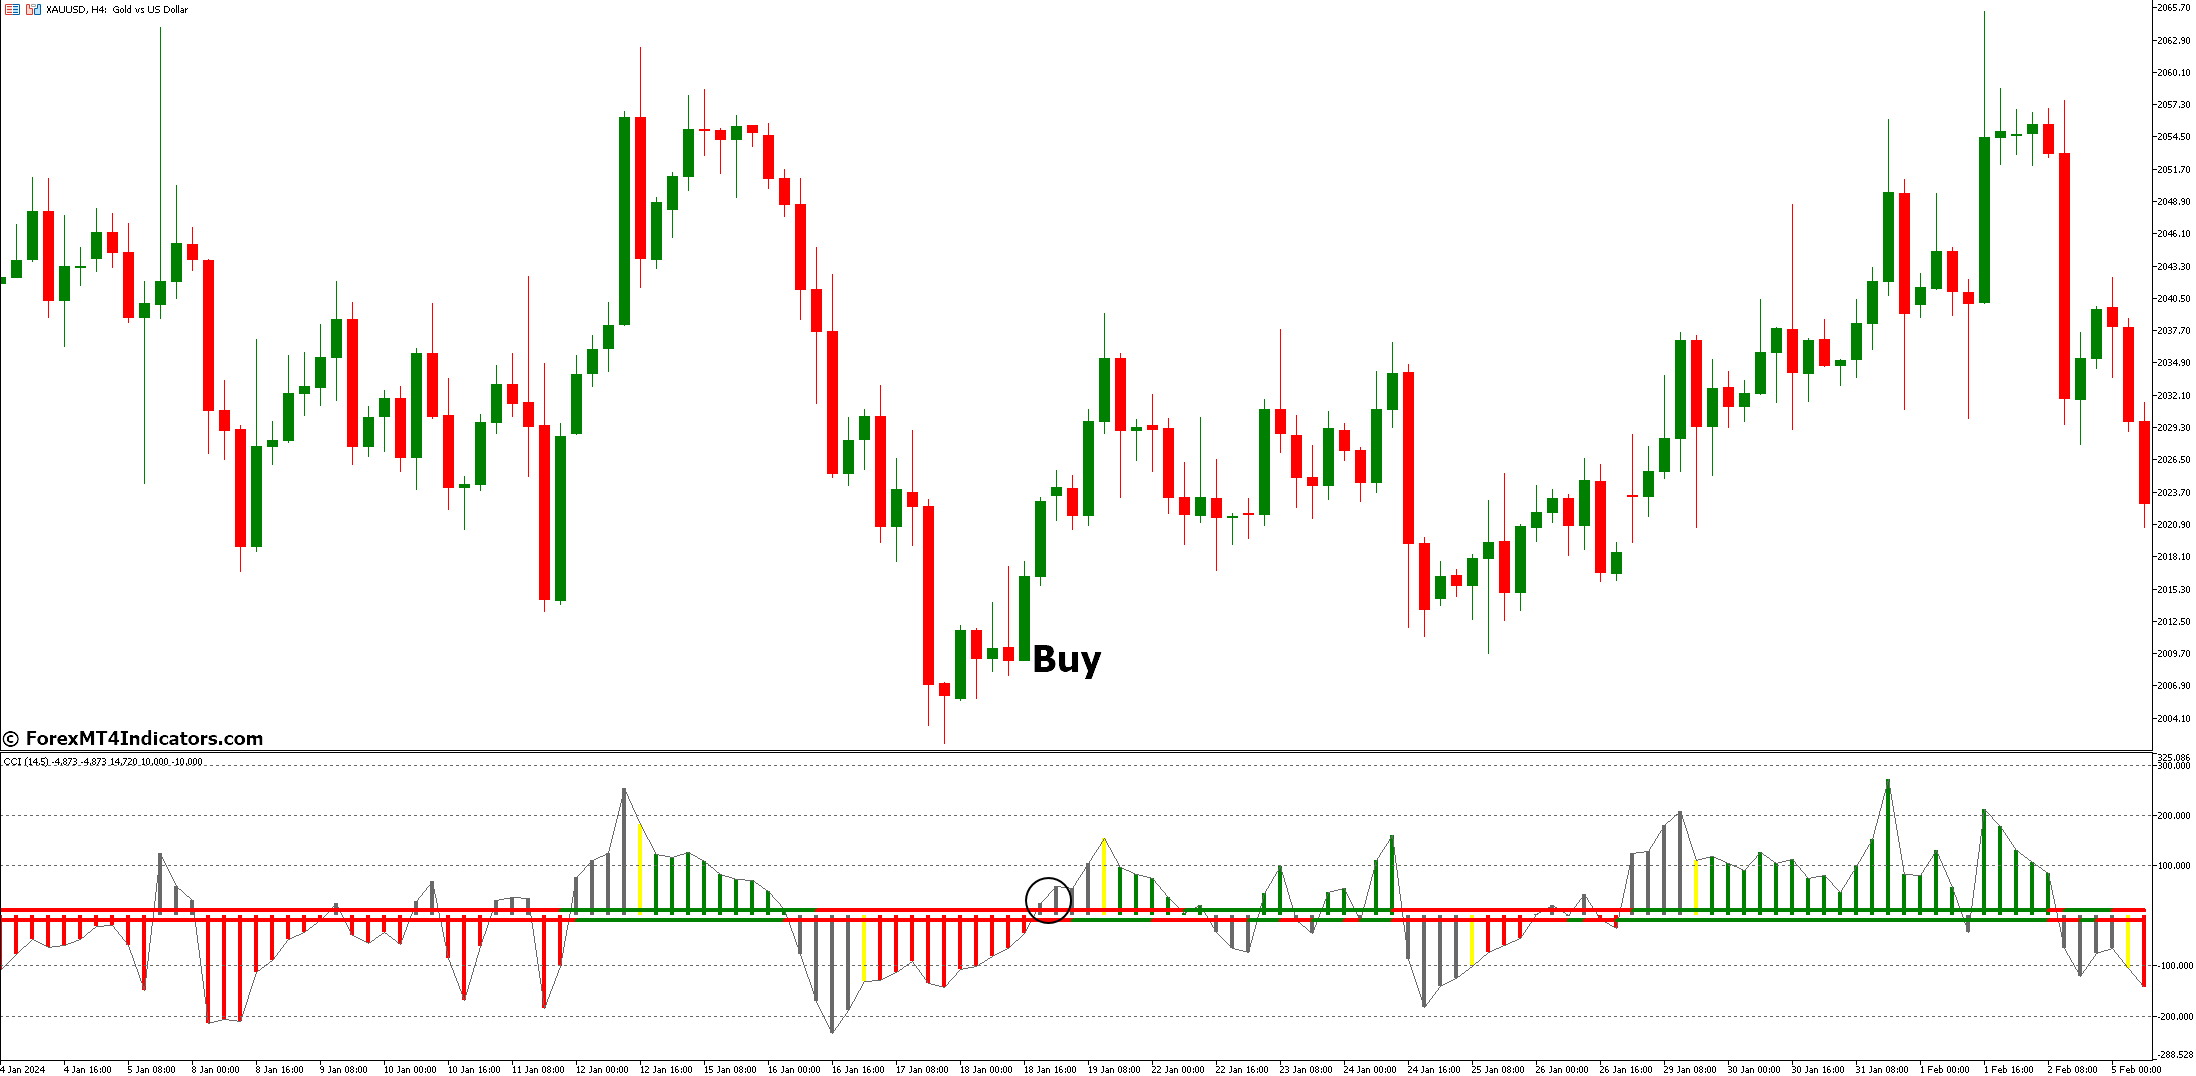
Buy Entry
- Bullish Price Action + CCI Breakout: Look for a bullish candlestick pattern (e.g., hammer, engulfing bar) near support. If the price decisively breaks above the support level and the CCI Woodies indicator line crosses above the zero line concurrently, it suggests a potential buying opportunity.
- Stop-Loss: Place your stop-loss order below the recent swing low or support level.
- Take-Profit: Consider taking profit at the next resistance level or based on a pre-determined risk-reward ratio (e.g., 1:2 risk-to-reward).
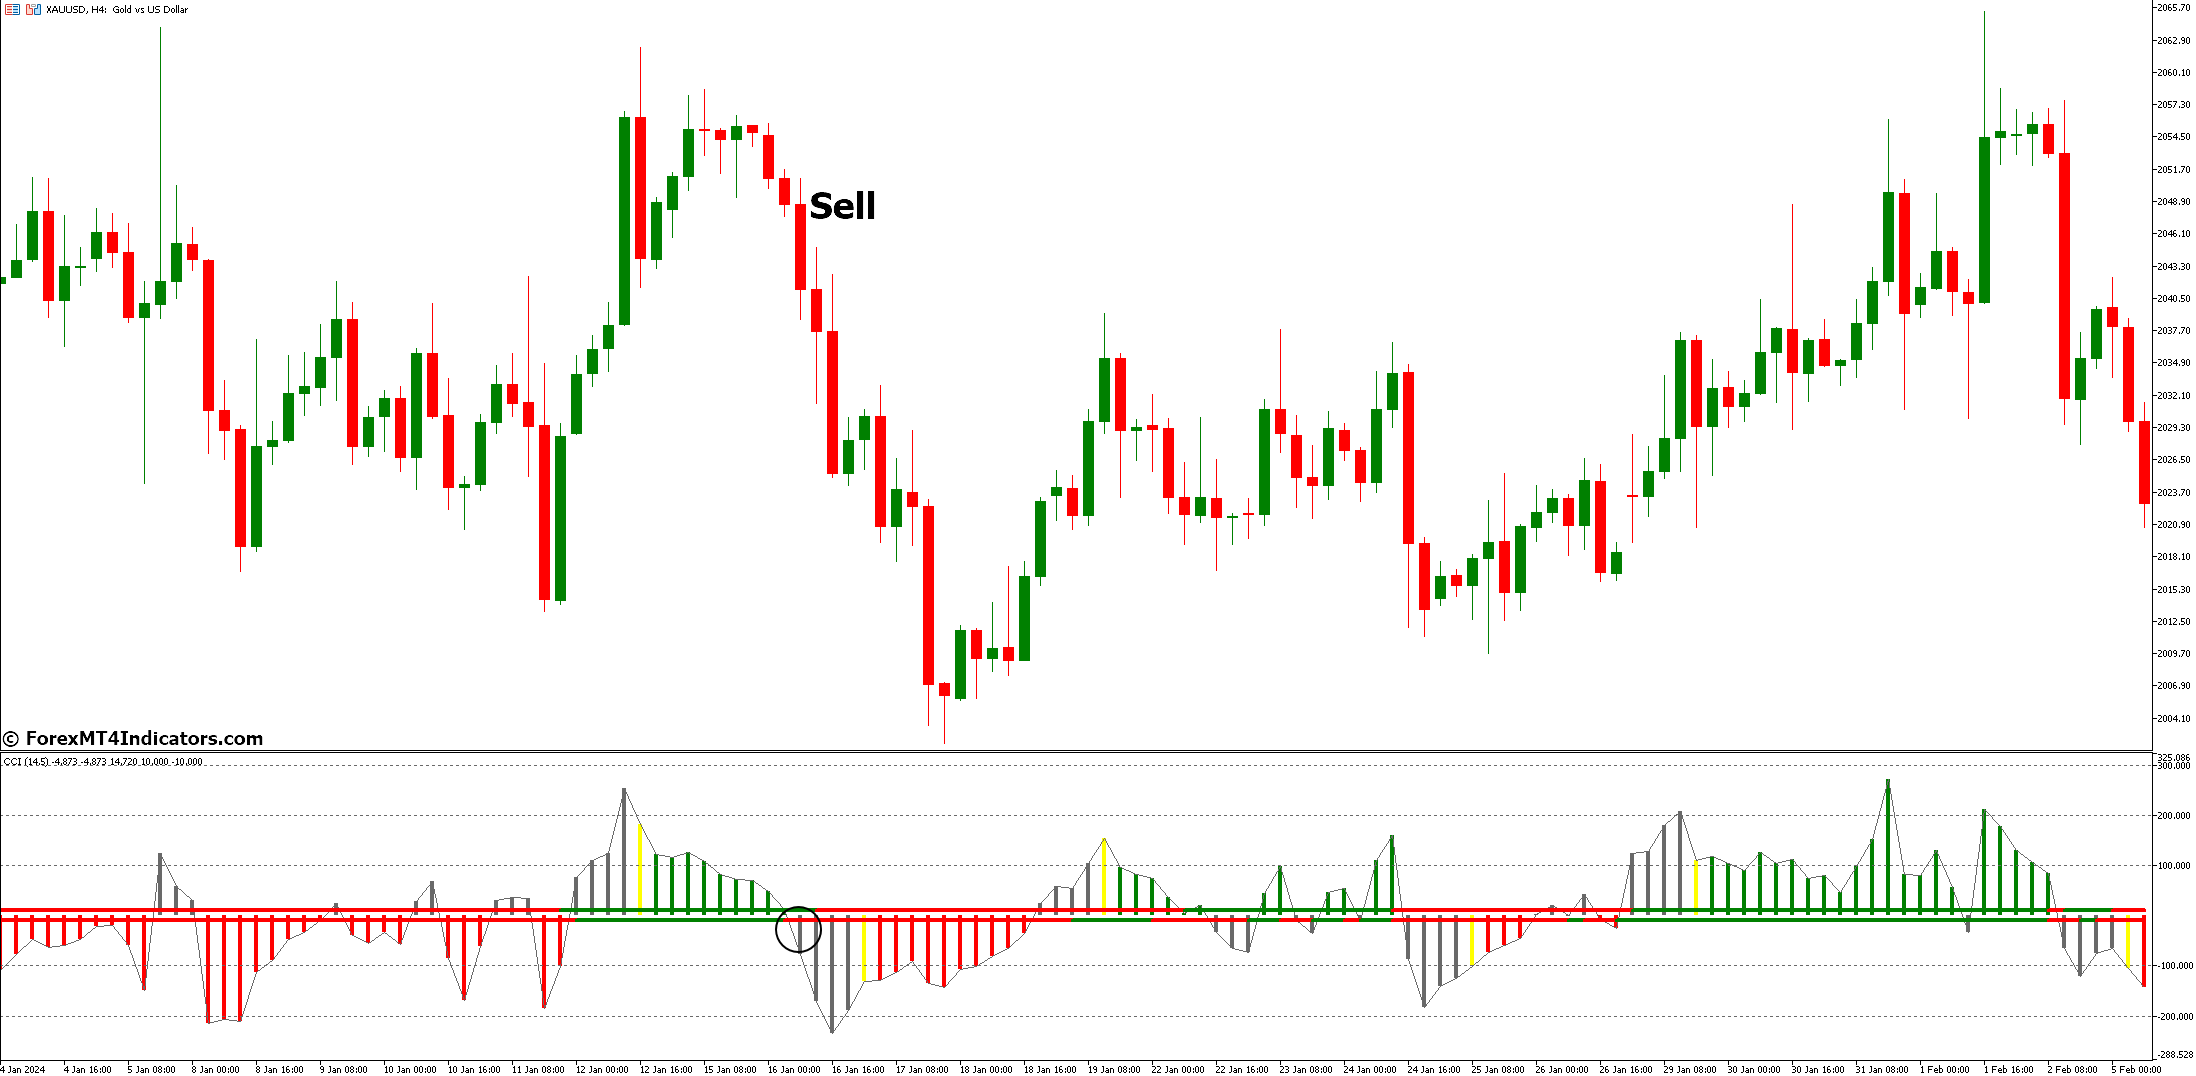
Sell Entry
- Bearish Price Action + CCI Breakdown: Look for a bearish candlestick pattern (e.g., shooting star, bearish engulfing bar) near resistance. If the price decisively breaks below the resistance level and the CCI Woodies indicator line crosses below the zero line concurrently, it suggests a potential selling opportunity.
- Stop-Loss: Place your stop-loss order above the recent swing high or resistance level.
- Take-Profit: Consider taking profit at the next support level or based on a pre-determined risk-reward ratio.
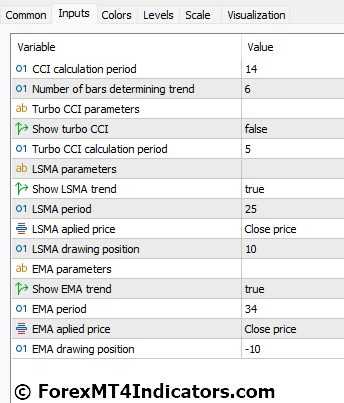
CCI Woodies MT5 Indicator Settings
Conclusion
CCI Woodies MT5 Indicator can be a valuable companion for traders seeking to identify potential entry and exit points in the forex market. By understanding its core functionalities, implementing strategic entry techniques based on price action confirmation, and adhering to sound risk management practices, you can harness the power of this indicator to navigate the ever-shifting tides of the market with greater confidence.
Recommended MT4/MT5 Brokers
XM Broker
- Free $50 To Start Trading Instantly! (Withdraw-able Profit)
- Deposit Bonus up to $5,000
- Unlimited Loyalty Program
- Award Winning Forex Broker
- Additional Exclusive Bonuses Throughout The Year
>> Sign Up for XM Broker Account here <<
FBS Broker
- Trade 100 Bonus: Free $100 to kickstart your trading journey!
- 100% Deposit Bonus: Double your deposit up to $10,000 and trade with enhanced capital.
- Leverage up to 1:3000: Maximizing potential profits with one of the highest leverage options available.
- ‘Best Customer Service Broker Asia’ Award: Recognized excellence in customer support and service.
- Seasonal Promotions: Enjoy a variety of exclusive bonuses and promotional offers all year round.
>> Sign Up for FBS Broker Account here <<
(Free MT4 Indicators Download)
Click here below to download:
Recent Posts
Categories
Related Articles
Weekly Market Outlook (11-15 November)
UPCOMING EVENTS:Monday: BoJ Summary of Opinions. (US Holiday)Tuesday: UK Labour Market report,...
ByglobalreutersNovember 10, 2024Newsquawk Week Ahead: US and China CPI, US Retail Sales, UK and Australian Jobs
Mon: US Holiday: Veterans Day. BoJ SOO (Oct), BoC SLOS; Norwegian CPI...
ByglobalreutersNovember 10, 2024China October CPI +0.3% y/y (expected +0.4%, prior +0.4%), deflation prospect lingers
October 2024 CPI rose 0.3% year-on-year, down from 0.4% in September, and...
ByglobalreutersNovember 9, 2024China Consumer Price Index (MoM) below expectations (-0.1%) in October: Actual (-0.3%)
China Consumer Price Index (MoM) below expectations (-0.1%) in October: Actual (-0.3%)
ByglobalreutersNovember 9, 2024


Leave a comment