


The allure of a shortcut to success is undeniable, and that’s precisely why the Holy Grail 1.6 MT4 Indicator has captured the imagination of many forex traders. This indicator promises to simplify the complex world of technical analysis by generating buy and sell signals, but is it truly a magic bullet or just clever marketing? This comprehensive guide will dissect the Holy Grail 1.6 MT4 Indicator, exploring its functionality, strengths, limitations, and how it can fit into your overall trading strategy.
Understanding MT4 and Technical Indicators
Before diving into the Holy Grail itself, let’s establish a foundation. The MT4 platform, or MetaTrader 4, is a widely used software platform for forex and CFD trading. It offers a vast array of charting tools and technical indicators, which are mathematical calculations based on historical price data. Technical indicators can help identify trends, gauge market sentiment, and potentially generate trading signals. However, it’s crucial to remember that indicators are just tools, not crystal balls.
Dissecting the Holy Grail 1.6 Components and Functionality
The Holy Grail 1.6 is an indicator built on the premise of combining two popular technical tools: Exponential Moving Averages (EMAs) and the Average Directional Movement Index (ADX). EMAs smooth out price fluctuations to reveal the underlying trend, while the ADX measures the strength of that trend. The indicator supposedly generates buy signals when the price touches and bounces off an EMA while the ADX indicates a strong trend. Conversely, sell signals are triggered when the price breaks below the EMA with a high ADX reading.
Strengths and Limitations of the Holy Grail 1.6
Like any tool, the Holy Grail 1.6 has its pros and cons.
Potential Advantages
- Simplicity: The indicator offers a seemingly straightforward way to identify potential entry and exit points.
- Customization: Some versions of the Holy Grail 1.6 allow for customization of parameters, allowing you to tailor it to your trading style.
Addressing Drawbacks and False Signals
- Lag: Indicators are inherently reactive, meaning they base their signals on past price data. This can lead to lagging behind actual price movements and generating false signals.
- Overfitting: Overly customized indicators can become “overfitted” to historical data, leading to poor performance in real-time trading.
- Repainting: Be wary of indicators that repaint their signals after the fact. This can create a false sense of accuracy and hinder your ability to learn from past mistakes. Look for indicators with a good reputation for not repainting signals.
The Psychology of Trading
Trading psychology is just as important as technical analysis. Common biases like confirmation bias, where we tend to favor information that confirms our existing beliefs, can cloud our judgment and lead to poor trading decisions. Here’s how to manage your emotions and develop a disciplined trading mindset:
- Recognize Biases: Educate yourself on common cognitive biases that can influence your trading decisions.
- Maintain Discipline: Develop a trading plan and stick to it, avoiding impulsive actions based on fear or greed.
- The Importance of Emotional Control: Emotions can be the enemy of a rational trader. Learn to manage your emotions and detach yourself from the outcome of individual trades.
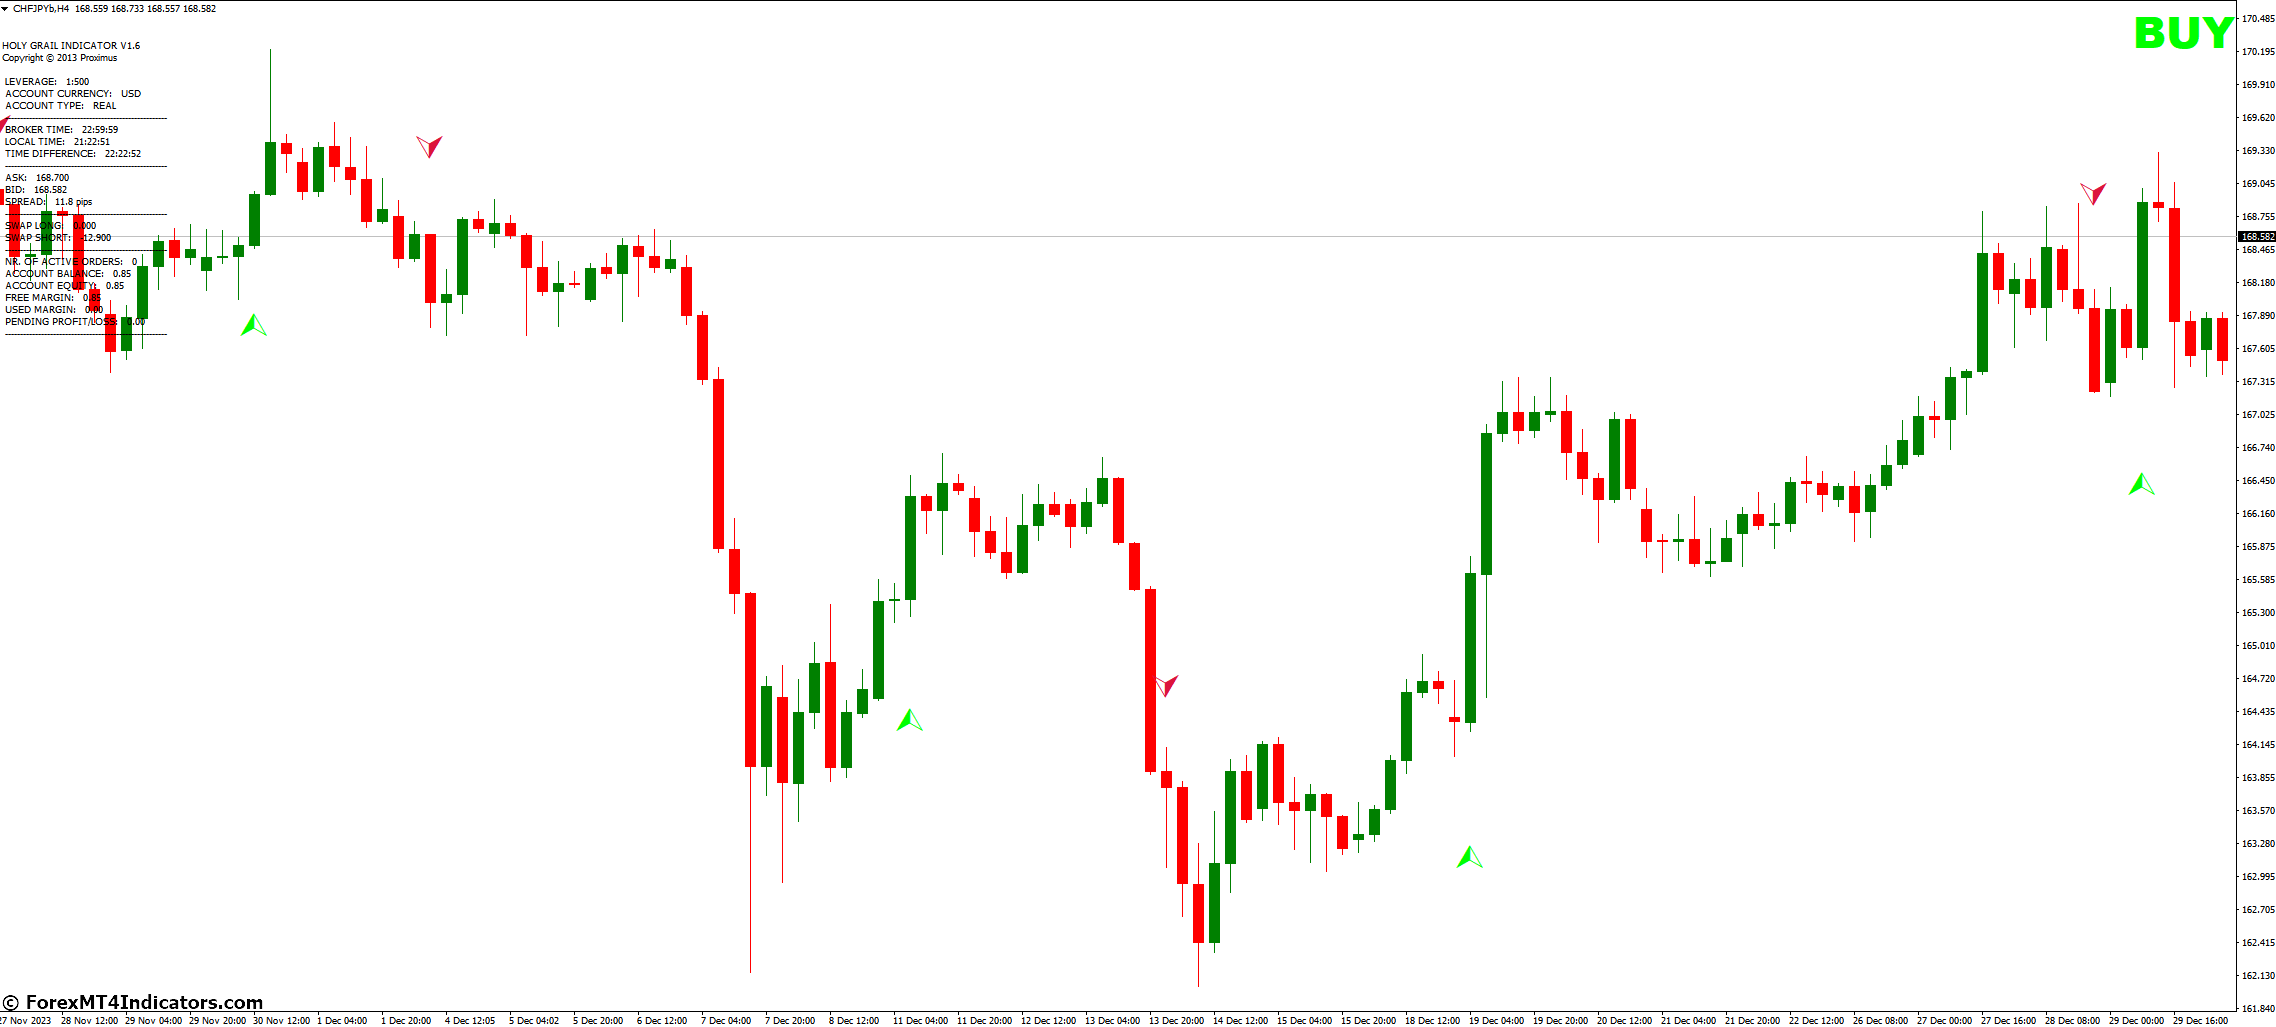
How to Trade with Holy Grail 1.6 Indicator
Buy Entry
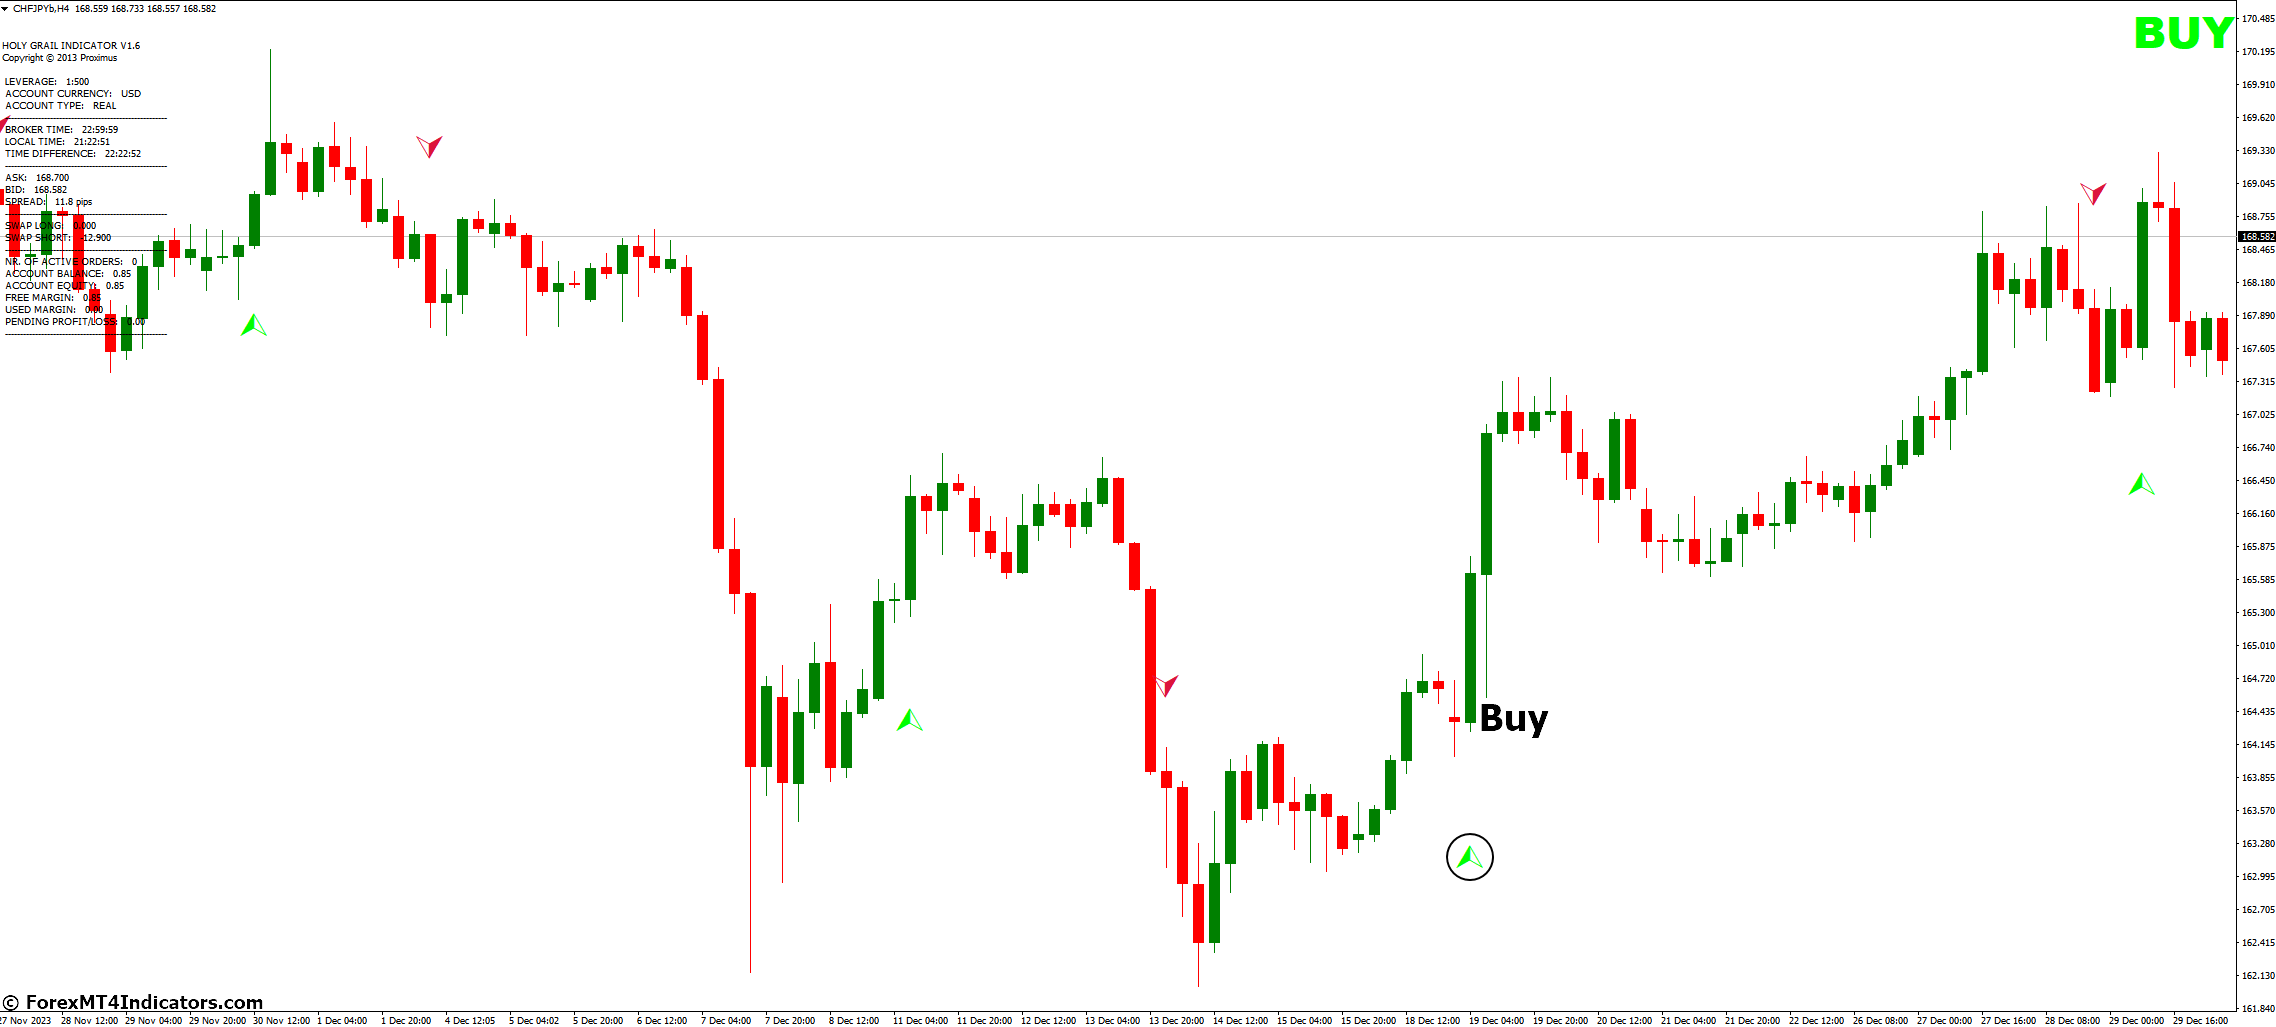
- Signal: A green arrow appears on the chart, ideally near the support zone (identified through price action or other indicators).
- Confirmation: Look for a bullish candlestick pattern (e.g., hammer, engulfing bar) coinciding with the green arrow.
- Entry: Place a buy order slightly above the green arrow (e.g., a few pips).
- Stop-Loss: Set a stop-loss order below the recent swing low (before the green arrow) or below support.
- Take-Profit: Consider a risk-reward ratio of 1:2 (target profit twice the distance of your stop-loss). Alternatively, target a nearby resistance level (identified through price action or other indicators).
Sell Entry
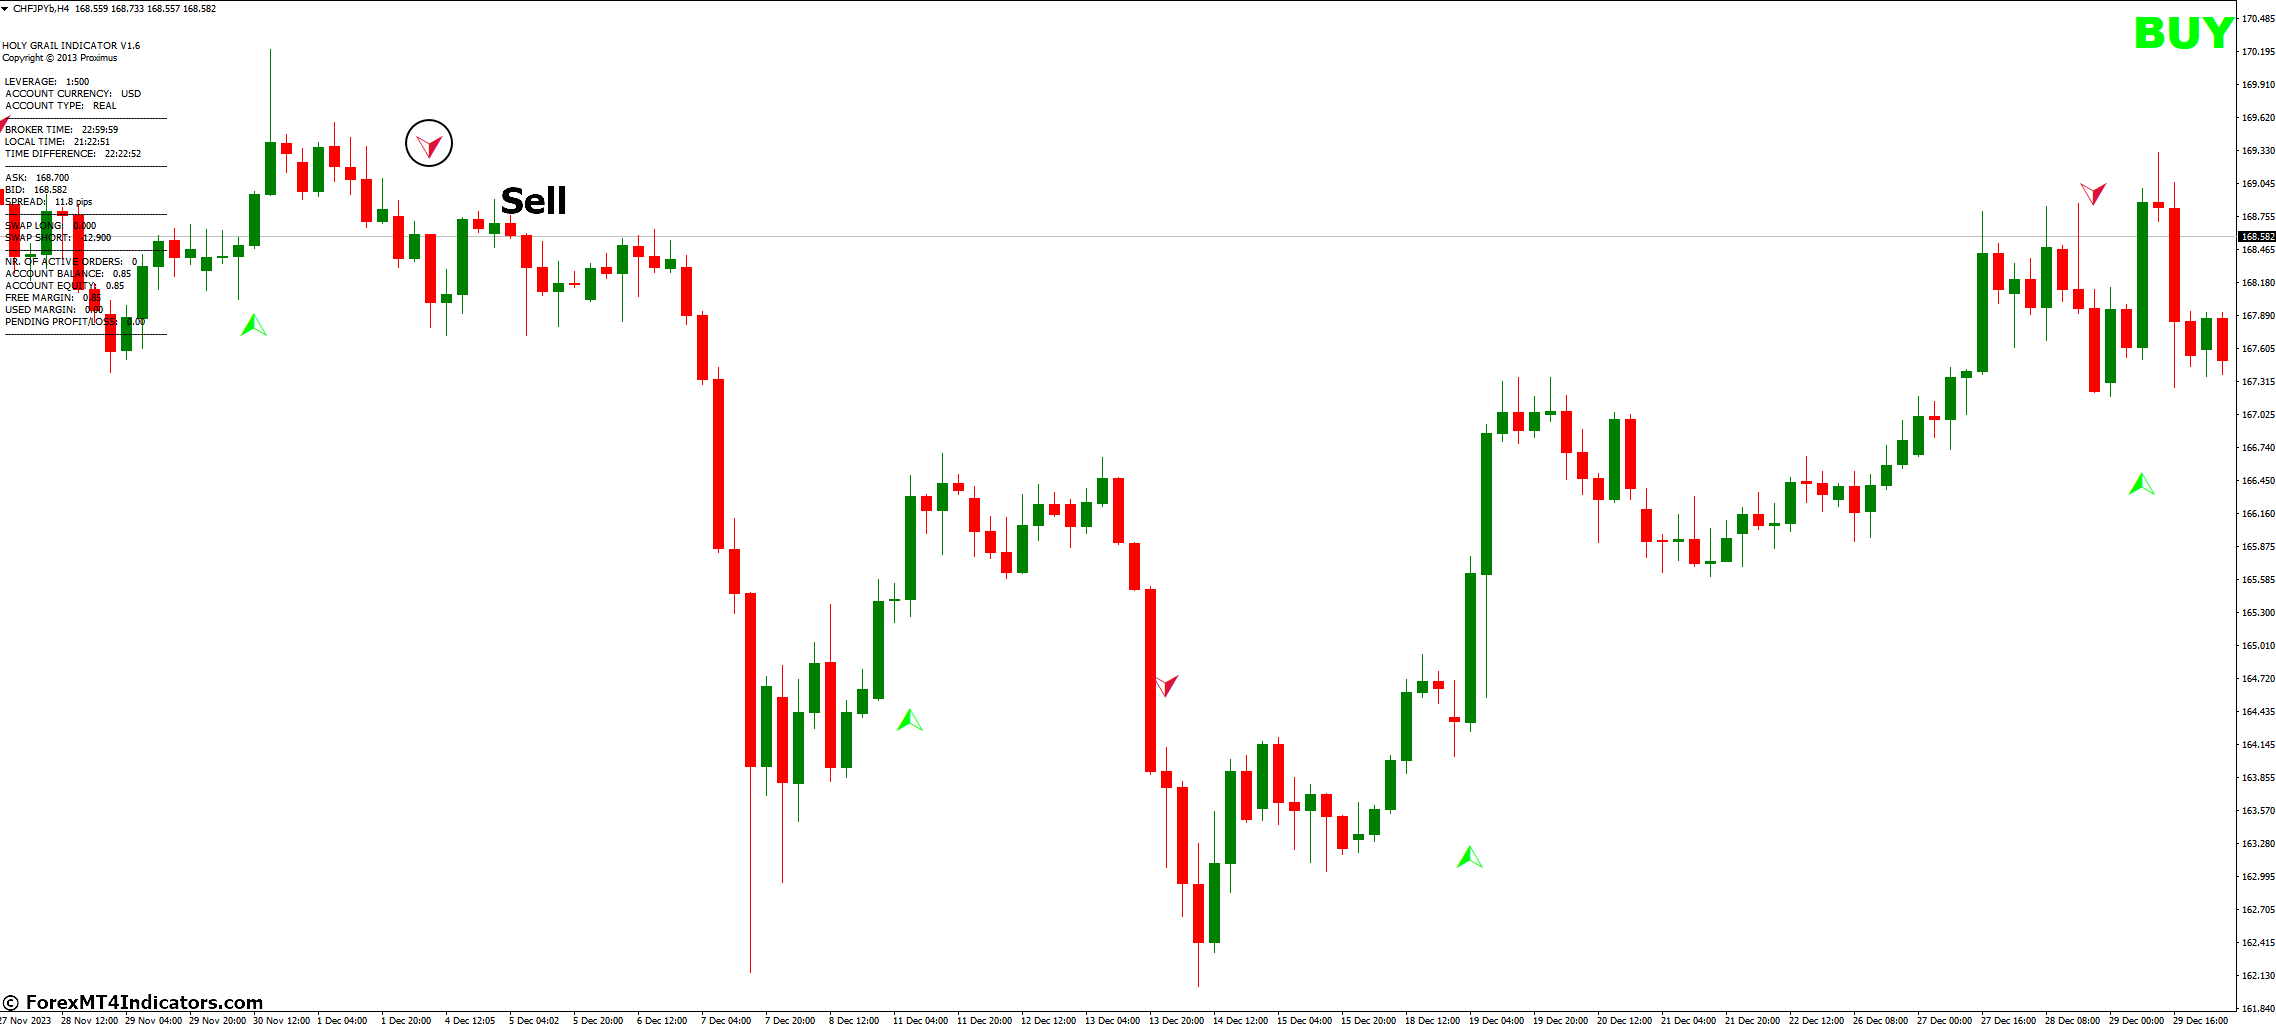
- Signal: A red arrow appears on the chart, ideally near the resistance zone.
- Confirmation: Look for a bearish candlestick pattern (e.g., shooting star, bearish engulfing) coinciding with the red arrow.
- Entry: Place a sell order slightly below the red arrow.
- Stop-Loss: Set a stop-loss order above the recent swing high (before the red arrow) or above resistance.
- Take-Profit: Consider a risk-reward ratio of 1:2 (target profit twice the distance of your stop-loss). Alternatively, target a nearby support level.
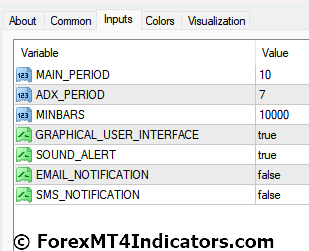
Holy Grail 1.6 Indicator Settings
Conclusion
The Holy Grail 1.6 MT4 Indicator can be a friend to traders who use it with the right approach. It can simplify technical analysis and offer a starting point for identifying trading opportunities. However, it’s not a magic bullet, and relying solely on its signals can be perilous.
Recommended MT4 Broker
- Free $50 To Start Trading Instantly! (Withdrawable Profit)
- Deposit Bonus up to $5,000
- Unlimited Loyalty Program
- Award Winning Forex Broker
- Additional Exclusive Bonuses Throughout The Year

>> Claim Your $50 Bonus Here <<

(Free MT4 Indicators Download)
Click here below to download:
Related Articles
Bitcoin or Ethereum?
Bitcoin or Ethereum: Which Crypto is the Better Investment in 2025?The Crypto...
German election preview: History will be made on Sunday, what to watch for
On Sunday, German voters go to the polls in a high-contested election....
FX Weekly Recap: February 17 – 21, 2025
The majors were all about trade tensions and central banks’ moves this...
Global Market Weekly Recap: February 17 – 21, 2025
Geopolitical developments continued to be a driving force in the markets, initially...
Leave a comment