- Home
- Features
- Business
- Active
- Sports
- Shop
Top Insights
How to Use Candlestick Patterns in Forex Trading

Feeling lost in the forex market? You’re not alone. Many traders get overwhelmed by charts and data. Candlestick patterns can help, but they might seem hard to learn.
Don’t worry, we’ve got you covered. This guide will show you how to use candlestick patterns. It will make the market clearer and boost your confidence.
Key Takeaways
- Candlestick patterns provide quick price information interpretation
- Understanding basic candlestick anatomy is key
- Bullish and bearish patterns help predict market trends
- Combining candlesticks with other indicators improves analysis
- Risk management is vital when trading with candlestick patterns
Understanding Candlestick Basics in Forex Markets
Candlestick charts are key in forex trading. They show price changes over time. They help see market mood and trends.
Anatomy of a Candlestick
A candlestick has three parts: the body, shadow, and color. The body shows the price range. The shadow shows the high and low prices. The color tells if prices went up or down.
Color Coding and Price Movement
Green or white candlesticks mean prices went up. Red or black ones mean prices went down. The body’s length shows trend strength.
Reading Time Frames on Candlestick Charts
Candlestick charts show price changes from seconds to months. Short times show quick changes. Long times show trends better.
| Time Frame | Description | Best Use |
|---|---|---|
| 1-30 minutes | Short-term price action | Day trading |
| 1-4 hours | Medium-term trends | Swing trading |
| Daily, Weekly, Monthly | Long-term trends | Position trading |
Knowing these basics helps traders understand the market. It helps them make better trading choices.
How to Use Candlestick Patterns in Forex Trading
Candlestick patterns are key in forex trading. They show market mood and future price moves. Traders use them to spot support and resistance levels. These levels are vital for many forex strategies.
Using candlestick patterns begins with spotting specific patterns. Each candlestick shows four important prices: open, close, high, and low. These patterns can signal when the market might change direction or keep going.
For instance, a hammer pattern at a downtrend’s bottom hints at a possible upturn. On the other hand, a hanging man pattern at an uptrend’s top might signal a downturn. These signs help traders make better choices.
| Pattern | Position | Signal |
|---|---|---|
| Hammer | Bottom of downtrend | Potential upward reversal |
| Hanging Man | Top of uptrend | Potential downward reversal |
| Morning Star | End of downtrend | Strong bullish reversal |
| Evening Star | End of uptrend | Strong bearish reversal |
Good candlestick pattern use is more than just seeing patterns. It’s about using these patterns with other tools to check trends. This mix is key to a strong forex strategy.
Essential Bullish Candlestick Patterns
Bullish patterns are key in forex trading. They often show when the market might turn up. Here are four important bullish patterns for spotting buying chances.
Hammer Pattern
The hammer pattern shows up after a downtrend. It has a small body with a long lower shadow, at least twice as long as the body. This means buyers are taking back control. The next day’s candle needs to be green to confirm.
Morning Star Formation
The morning star has three candles: a long red, a short-bodied, and a long green. It’s a strong sign of a bullish reversal. The third candle must engulf the second to show strong buying.
Bullish Engulfing Pattern
 A bullish engulfing pattern has two candles: a short red body engulfed by a larger green one. It shows strong buying pressure, even more so with high volume. This pattern often happens at support levels, ending a downtrend.
Example
Bearish Engulfing Pattern
 A bearish engulfing pattern has two candles: a Long green body engulfed by a larger red one. It shows strong selling pressure, even more so with high volume. This pattern often happens at support levels, ending a downtrend.
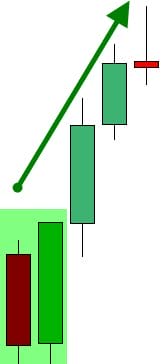
Three consecutive long green candles with small shadows form the three white soldiers’ pattern. It’s a strong sign of an uptrend after a downtrend. It shows buyers are pushing hard over several periods.
| Pattern | Formation | Significance |
|---|---|---|
| Hammer | Small body, long lower shadow | Buyers regaining control |
| Morning Star | Three candles: red, short, green | Strong bullish reversal |
| Bullish Engulfing | Short red engulfed by large green | Strong buying pressure |
| Three White Soldiers | Three long green candles | Persistent buying pressure |
Key Bearish Candlestick Patterns
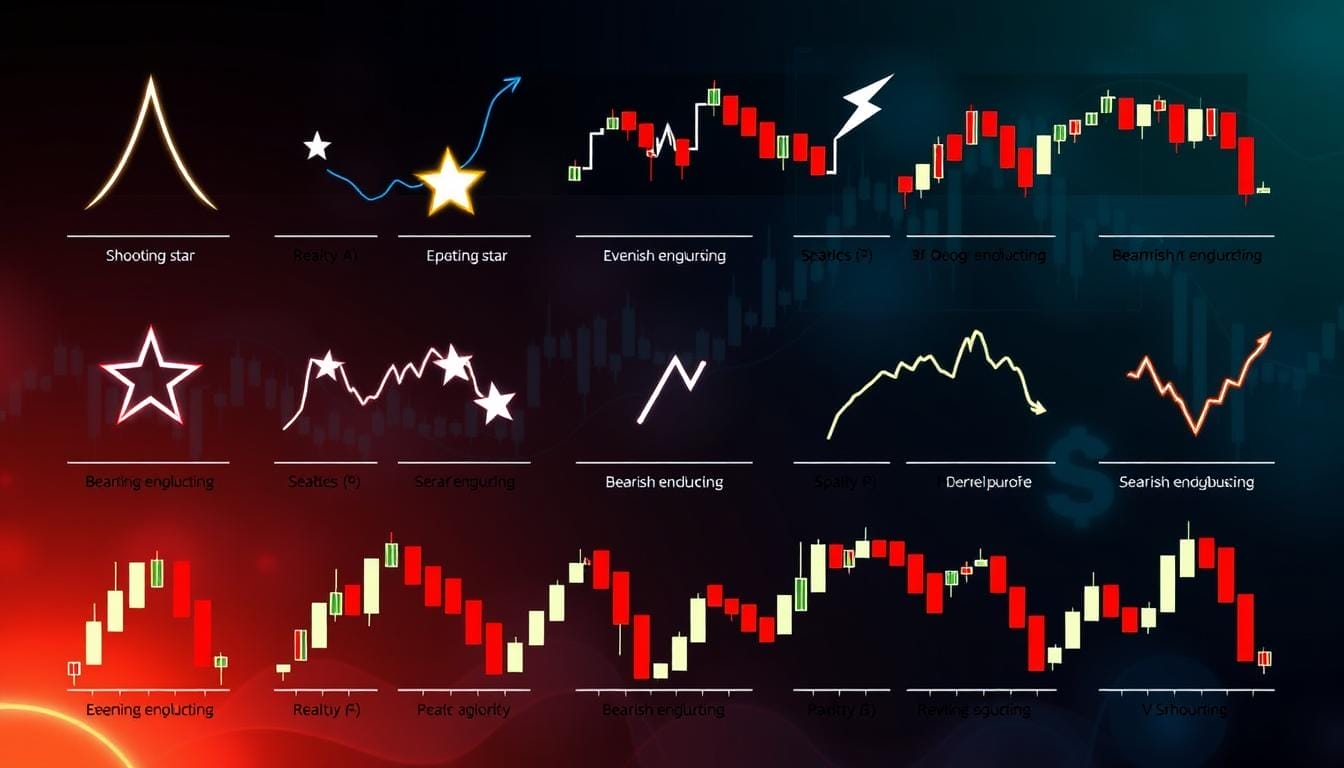
Bearish patterns are key in forex trading. They show downtrends and when to sell. Let’s look at some important bearish candlestick patterns for trading.
Hanging Man Pattern
The Hanging Man pattern shows up at the end of an uptrend. It has a small body and a long lower shadow. This means sellers are taking over.
This pattern often means a market reversal and more selling.
Evening Star Formation
An Evening Star is a three-candle pattern at the end of an uptrend. It starts with a big bullish candle, then a small-bodied one, and ends with a bearish candle.
This shows a change in market mood from bullish to bearish.
Dark Cloud Cover
The Dark Cloud Cover is a two-candle pattern. It starts with a bullish candle and is followed by a bearish one. This bearish candle opens above the previous close but closes below its midpoint.
This pattern shows buyer momentum is weakening and selling pressure is growing.
Three Black Crows
Three consecutive bearish candles with small or no shadows form the Three Black Crows pattern. Each candle opens within the previous one’s body and closes near its low.
This strong bearish pattern often signals a strong downtrend.
| Pattern | Candles | Trend Indication |
|---|---|---|
| Hanging Man | 1 | Potential reversal |
| Evening Star | 3 | End of uptrend |
| Dark Cloud Cover | 2 | Weakening buyers |
| Three Black Crows | 3 | Strong downtrend |
Continuation Patterns for Trend Trading
Trend continuation patterns are key in forex trading. They help traders spot when the market is consolidating or moving neutrally. Unlike reversal patterns, they show the trend is likely to keep going after a short pause.
Patterns like the Doji, Spinning Top, and Rising/Falling Three Methods are common. They happen in 1-5 candles. Larger patterns can last 10-50 candles. Traders wait for 2-3 candles after a pattern to make sure it’s real.
The Rising Three Method is a bullish pattern. It has 5 candles: a long bar up, then 3 short bars down, and ends with a long bar up. The Falling Three Method is the opposite for bearish trends.
Continuation patterns are very good at predicting market direction:
- Pennants occur in 10-15% of significant price movements
- Flags produce successful breakouts 70% of the time
- Triangle patterns indicate continuation with 60-70% accuracy
- Wedge patterns show a 65-75% probability of breakouts in the initial trend direction
To get the most out of these patterns, traders should look at volume and use other technical indicators. This helps confirm the trend’s strength and makes trading decisions better.
| Pattern | Success Rate | Average Consolidation Time |
|---|---|---|
| Bullish Pennant | 70%+ | 1-3 weeks |
| Bearish Pennant | 65% | 1-3 weeks |
| Bullish Rectangle | 55-65% | 3-4 weeks |
| Bearish Rectangle | 55-65% | 3-4 weeks |
Multiple Candlestick Patterns and Formations
Forex traders use complex patterns to predict price action. These patterns, made of multiple candlesticks, give insights into market trends. Let’s look at some key formations that can boost your trading strategy.
Triangle Patterns
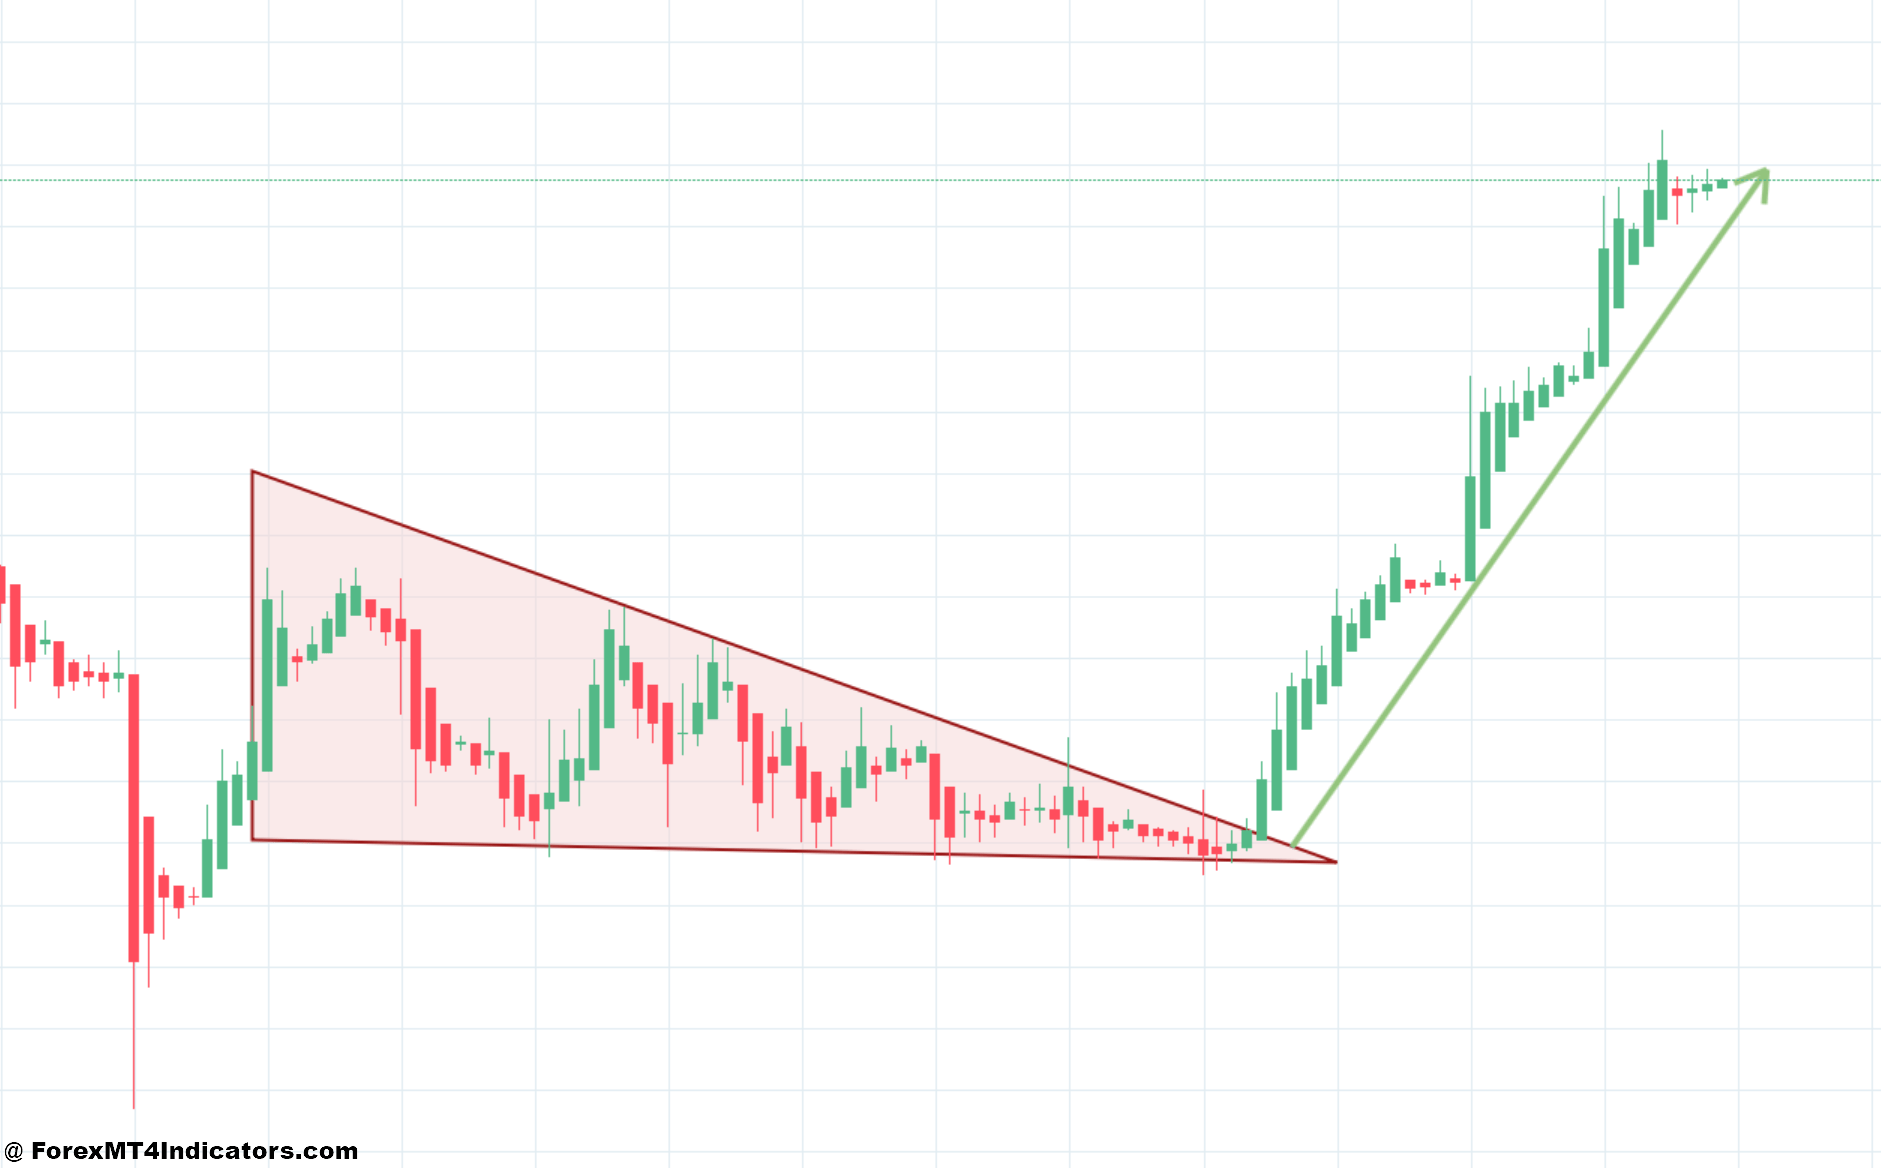
Triangle patterns are common in forex markets. They include ascending, descending, and symmetrical types. Ascending triangles often happen after uptrends, showing a trend will continue.
Descending triangles appear after downtrends, signaling a possible bear run if support breaks. Symmetrical triangles show market indecision and a big move is likely when a trend line breaks.
Flag Patterns
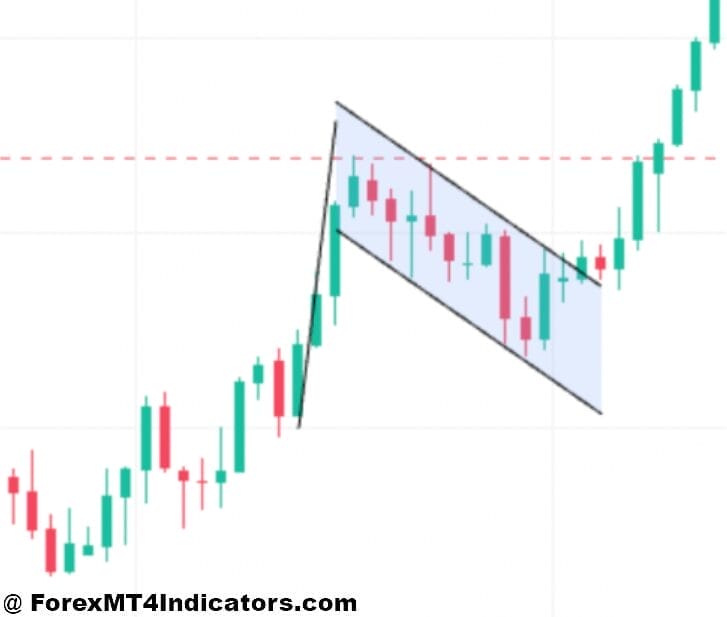
Flag patterns are short-term consolidation patterns after strong price moves. Bullish flags follow upward moves, and bearish flags follow downtrends. These patterns often lead to big price moves in the previous trend’s direction.
Wedge Formations
Wedges are like triangles but slope against the trend. They can signal reversals or continuations, based on their slope. During a wedge, traders see falling volatility and volume, showing market indecision.
| Pattern | Occurrence | Indication |
|---|---|---|
| Ascending Triangle | After uptrends | Continuation |
| Descending Triangle | After downtrends | Potential reversal |
| Symmetrical Triangle | Any trend | Indecision |
| Flags | After strong moves | Short-term consolidation |
| Wedges | Against trend | Potential reversal |
Knowing these complex patterns can greatly improve your forex trading. Remember, successful chart analysis combines pattern recognition with technical indicators for better predictions.
Combining Candlestick Analysis with Technical Indicators
Candlestick patterns give us great insights into market trends. By using them with other tools, traders can make better choices. Let’s see how to boost candlestick analysis with important trading indicators.
Support and Resistance Levels
Support and resistance levels show where prices might change direction. A candlestick pattern near these levels can mean a big trend change. For example, a bullish engulfing pattern near a support level might start an uptrend.
Volume Analysis
The volume shows how strong a candlestick pattern is. High volume with a bullish engulfing pattern means strong buying. This makes an uptrend more likely. The on-balance volume (OBV) shows who’s buying and selling, backing up candlestick signs.
Trend Line Integration
Trend lines show market trends clearly. A candlestick pattern breaking a trend line often means a trend change. For example, a bearish engulfing pattern breaking an upward trend line might signal a downtrend.
| Indicator | Function | Candlestick Synergy |
|---|---|---|
| Moving Averages | Smooth price fluctuations | Confirm trends with candlestick patterns |
| RSI | Identify overbought/oversold conditions | Strengthen reversal signals |
| Fibonacci Retracement | Identify possible support/resistance | Improve accuracy of trend reversals |
Using these technical indicators with candlestick patterns helps traders analyze the market better. This mix makes trading signals more accurate. It gives traders a solid way to make decisions in forex trading.
Common Trading Mistakes to Avoid

Forex trading with candlestick patterns can be tricky. Many traders fall into common traps that hurt their success. One big mistake is relying too much on a single pattern. This can lead to poor decisions in the fast-paced forex market.
Another error is ignoring the bigger market picture. Candlestick patterns don’t work in a vacuum. They need context to be useful. Traders often overlook other factors like market trends and economic news.
Emotional trading is a major pitfall. Fear and greed can cloud judgment, leading to trading errors and losses. It’s key to stick to a well-planned strategy and not let emotions drive decisions.
Proper risk management is often overlooked. Many traders bet too much on a single trade, risking big losses. Setting stop-losses and managing position sizes are key to long-term success.
- Not confirming signals with other indicators
- Overtrading based on minor patterns
- Failing to adapt to changing market conditions
- Neglecting to keep a trading journal for review
By avoiding these common mistakes, traders can improve their forex trading skills. Success comes from pattern recognition, market awareness, and solid risk management.
Risk Management Strategies with Candlestick Trading
Effective risk management is key in forex trading, using candlestick patterns. Traders must balance profits with keeping their capital safe. Let’s look at strategies to manage risk and use candlestick analysis.
Position Sizing
Smart position sizing is key for long-term success. Limit each trade to 1-2% of your total account balance. This keeps your capital safe, even if a trade fails.
For example, a $10,000 account risks no more than $200 per trade.
Stop Loss Placement
Use candlestick patterns to set strategic stop losses. Place stops below support levels for long trades and above resistance for short trades. The Hammer pattern can signal a possible upward price, making it a good stop-loss point in bullish trades.
Trade Entry and Exit Rules
Make clear rules for entering and exiting trades based on candlestick signals. Enter long positions when bullish patterns form near support levels—exit when bearish patterns appear or your profit target is reached.
| Risk Management Strategy | Key Points |
|---|---|
| Position Sizing | 1-2% of account balance per trade |
| Stop Loss Placement | Below support for long trades, above resistance for short trades |
| Trade Entry | Enter on bullish patterns near support levels |
| Trade Exit | Exit on bearish patterns or when the profit target is reached |
Good money management and trading psychology are as important as technical analysis. By combining these strategies with candlestick pattern insights, you can build a stronger trading approach. This will help improve your chances of success in the forex market.
Conclusion
Candlestick patterns are key in forex strategy. They show price movements clearly. These patterns, made of four price points, help see market trends and possible changes.
Green bodies mean the market is going up. Red bodies show it’s going down. More candles in a row make these signs stronger.
Using candlestick trading with other tools makes it more reliable. Patterns like the Shooting Star and Morning Star give important clues. Big patterns and longer time frames are usually more accurate.
Good forex trading mixes technical analysis, risk control, and learning. Candlestick patterns are powerful but work best with other tools. As traders get better, they understand these patterns better. This helps them move through the complex forex market.
Recent Posts
Categories
Related Articles
Bitcoin or Ethereum?
Bitcoin or Ethereum: Which Crypto is the Better Investment in 2025?The Crypto...
ByglobalreutersFebruary 22, 2025German election preview: History will be made on Sunday, what to watch for
On Sunday, German voters go to the polls in a high-contested election....
ByglobalreutersFebruary 22, 2025FX Weekly Recap: February 17 – 21, 2025
The majors were all about trade tensions and central banks’ moves this...
ByglobalreutersFebruary 21, 2025Global Market Weekly Recap: February 17 – 21, 2025
Geopolitical developments continued to be a driving force in the markets, initially...
ByglobalreutersFebruary 21, 2025






Leave a comment