- Home
- Features
- Business
- Active
- Sports
- Shop
Top Insights

The world of technical analysis can feel overwhelming at times, with a seemingly endless arsenal of indicators vying for your attention. But fear not, intrepid trader! Today, we’ll be delving into a valuable tool specifically designed to shed light on volume the Percentage Volume Oscillator (PVO) for the MT4 platform.
Whether you’re a seasoned chart veteran or just starting your technical analysis journey, understanding volume is crucial. After all, price movements don’t happen in a vacuum – they’re fueled by the buying and selling pressure of market participants. The PVO steps in to help you decipher this vital information, offering valuable insights into the strength and momentum behind price movements.
A Glimpse Under the Hood
So, how exactly does the PVO work its magic? It all boils down to a clever combination of moving averages and, of course, volume data. The indicator calculates the difference between two exponential moving averages (EMAs) of volume, expressed as a percentage of the larger moving average. This clever trick allows the PVO to oscillate above and below a centerline, providing visual cues about the relative dominance of buyers and sellers.
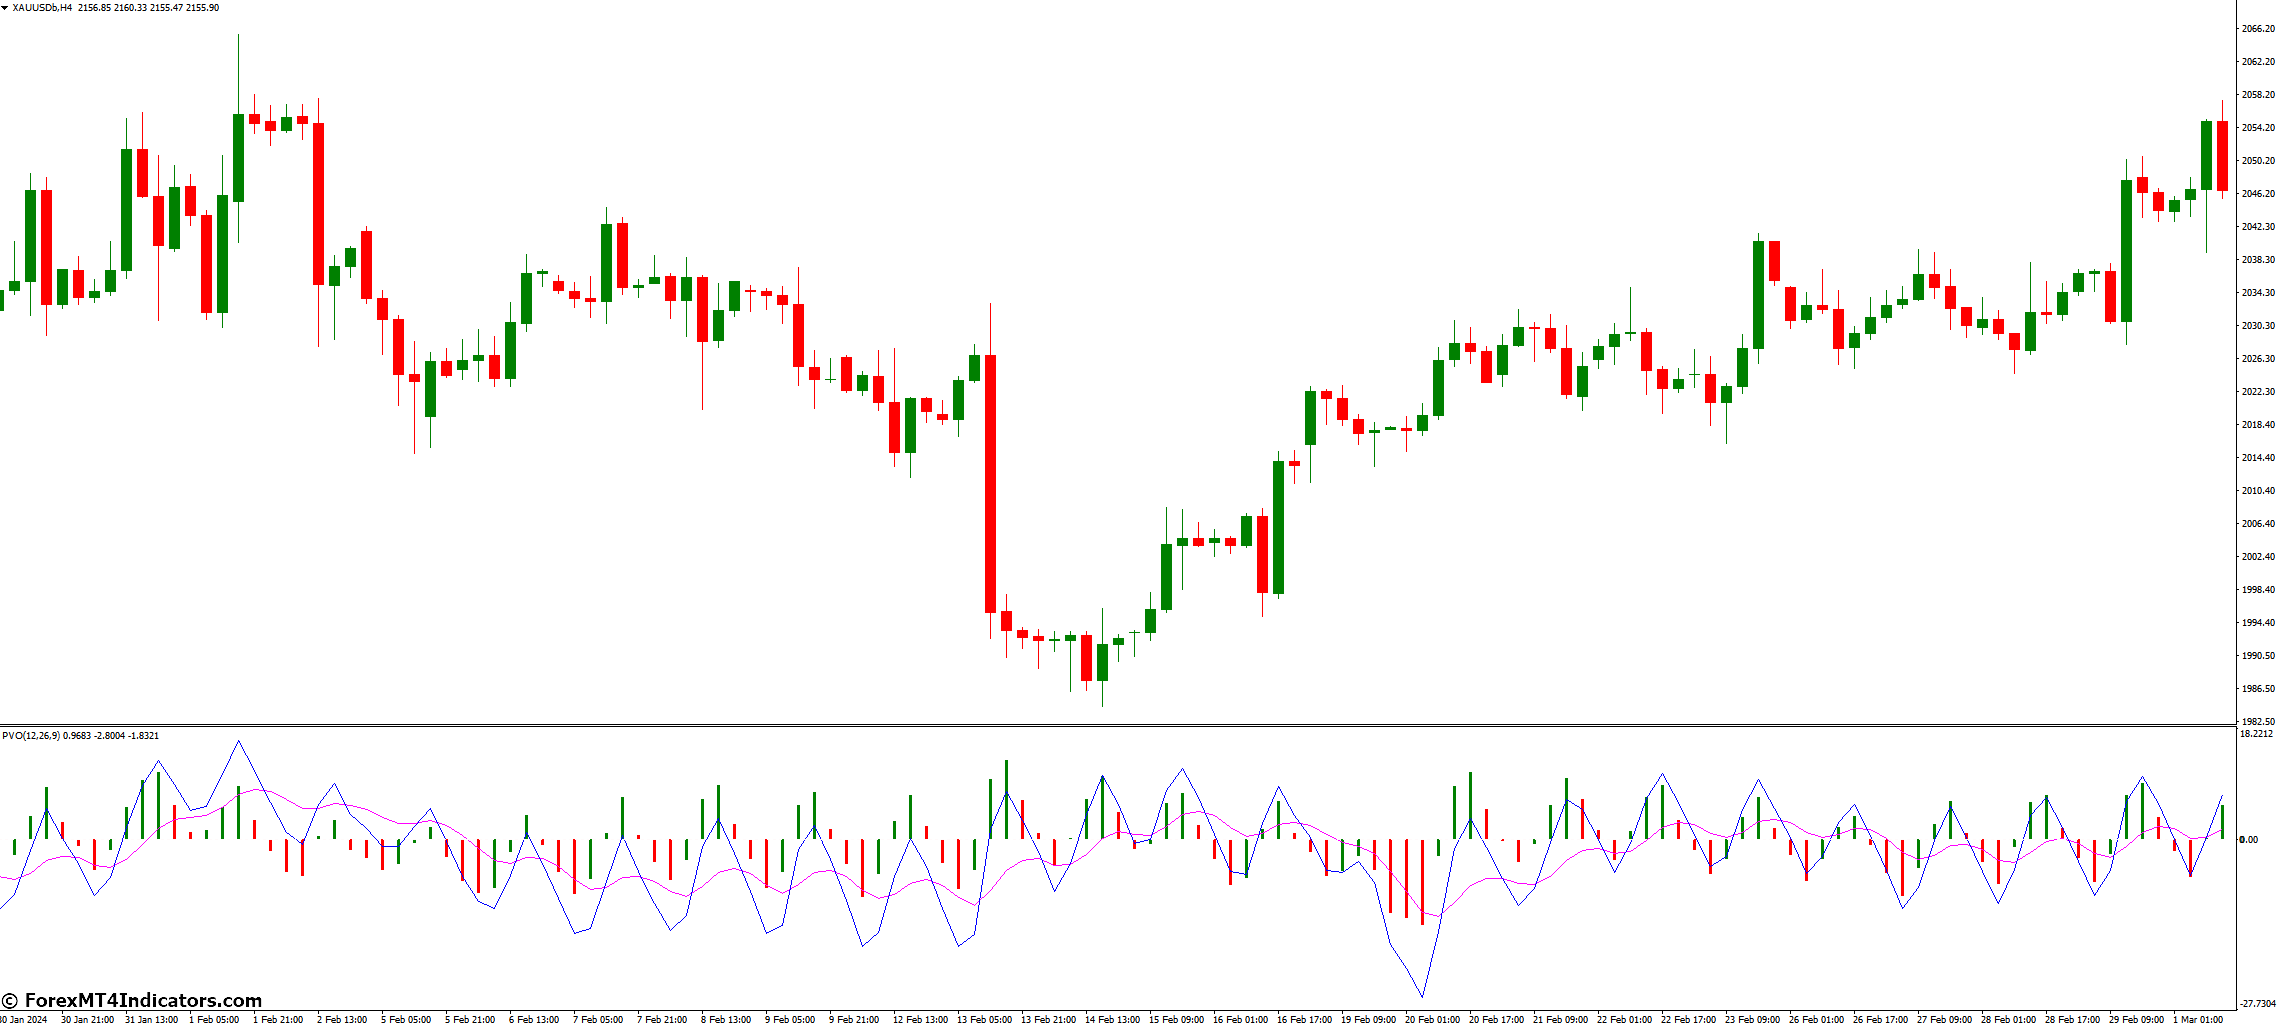
Imagine the PVO as a volume whisperer, translating the often cryptic language of trading volume into a clear and concise message. Here’s a breakdown of the key components that make up the PVO’s visual representation:
- PVO Lines: These are the two EMAs that form the backbone of the indicator. You can customize the timeframes of these moving averages to suit your trading style and the specific market you’re analyzing.
- The PVO Histogram: This visual aid complements the PVO lines by displaying bars that change color based on the PVO’s value. Green bars typically indicate periods of higher volume, while red bars suggest lower volume.
Harnessing the PVO’s Power
The beauty of the PVO lies in its versatility. It can be used for a variety of purposes, from identifying trends in volume to confirming price action signals. Here are some key ways you can incorporate the PVO into your trading toolbox:
- Identifying Volume Trends: By analyzing the PVO’s position relative to the centerline, you can gauge the overall volume in the market. A PVO consistently above the centerline suggests expanding volume, often associated with strong trends. Conversely, a PVO persistently below the centerline indicates contracting volume, potentially signaling weakening trends or market indecision.
- Confirmation of Price Action Signals: Price movements alone don’t always tell the whole story. The PVO can act as a valuable confirmation tool. For instance, a price breakout accompanied by a rising PVO strengthens the bullish case, suggesting strong buying pressure behind the move. Conversely, a price swing lower alongside a declining PVO reinforces the bearish sentiment.
- Trading with PVO Divergences: This can be a powerful technique for identifying potential trend reversals. A bullish divergence occurs when prices make lower lows while the PVO forms higher lows. This suggests a weakening downtrend and a potential buying opportunity on the horizon. Conversely, a bearish divergence appears when prices create higher highs while the PVO registers lower highs. This can be a warning sign of an impending reversal, prompting you to consider taking profits or initiating short positions.
Advanced Techniques for the Discerning Trader
As you gain experience with the PVO, you can explore more advanced techniques to further refine your trading strategies. Here are a couple of approaches worth considering:
- Combining PVO with Other Indicators: The PVO is a powerful tool on its own, but its effectiveness can be amplified when used alongside other technical indicators. Popular pairings include the Relative Strength Index (RSI) or the MACD. These combinations can provide a more comprehensive picture of market conditions, helping you make more informed trading decisions.
- PVO Volume Filters: While the PVO provides valuable insights into volume trends, it doesn’t explicitly tell you the exact volume levels. To address this, you can incorporate volume filters into your trading strategy. This involves setting specific volume thresholds alongside your PVO analysis. For example, a strong PVO signal becomes even more compelling if it’s accompanied by a surge in trading volume.
Understanding the PVO’s Limitations
Even the most sophisticated technical indicators have their limitations, and the PVO is no exception. Here are some crucial points to consider:
- Shortcomings of a Volume-Based Indicator: The PVO thrives in trending markets where volume changes are readily apparent. However, its effectiveness can be diminished in choppy or range-bound markets where volume fluctuations are less pronounced. In these scenarios, the PVO might generate more noise than actionable signals.
- PVO vs. Traditional Volume Analysis: The PVO shouldn’t replace your understanding of traditional volume analysis techniques. Volume bars on your chart and indicators like the On-Balance-Volume (OBV) can provide valuable complementary insights. Think of the PVO as a magnifying glass that enhances your ability to interpret volume data, but don’t neglect the raw data itself.
Optimizing the PVO for Different Market Conditions
The beauty of the PVO lies in its customizability. You can adjust its settings to cater to the specific market you’re trading and your preferred trading style. Here are some key considerations:
- Choosing the Right Moving Average Lengths: The timeframes of the EMAs used in the PVO calculation significantly impact its sensitivity. Shorter EMAs react faster to volume changes, making the PVO more responsive but prone to generating more noise. Conversely, longer EMAs provide a smoother picture but might miss out on subtle volume shifts. Experiment with different EMA lengths to find the sweet spot that aligns with your trading timeframe and risk tolerance.
- PVO in Trending vs. Ranging Markets: As mentioned earlier, PVO excels in trending markets. In these conditions, you might opt for shorter EMA lengths to capture the directional volume shifts. However, for range-bound markets, consider using longer EMAs to smooth out the PVO’s fluctuations and identify potential breakouts from the trading range.
A Powerful Tool in Your Trading Arsenal
By now, you’ve gained a solid understanding of the Percentage Volume Oscillator and its potential applications in your trading strategies. Remember, the PVO is a valuable tool, but it’s just one piece of the puzzle. Here are some key takeaways to keep in mind:
- The PVO translates volume data into a user-friendly format, helping you gauge market strength and momentum.
- It can be used to identify volume trends, confirm price action signals, and potentially spot trend reversals through divergences.
- Combining the PVO with other indicators and employing volume filters can further refine your trading strategies.
- No indicator is perfect. Understand the PVO’s limitations, particularly in choppy markets, and always use it in conjunction with other forms of technical analysis and sound risk management practices.
The PVO can be a powerful asset in your trading journey, empowering you to make more informed decisions based on volume analysis. Remember, consistent practice, continued learning, and a disciplined approach to risk management are key ingredients for long-term trading success. So, put your newfound knowledge of the PVO to the test, and don’t be afraid to experiment to find what works best for you in the dynamic world of the markets.
Real-World Examples
Understanding the theoretical aspects of an indicator is essential, but seeing it in action truly brings the concepts to life. Let’s explore a couple of hypothetical scenarios where the PVO can be a valuable tool:
Scenario 1: Confirmation of a Bullish Breakout
Imagine you’re analyzing a stock chart and identifying a potential breakout from a bullish ascending triangle pattern. The price decisively breaks above the resistance line, and you’re considering entering a long position. However, before pulling the trigger, you decide to consult the PVO. The PVO displays a strong uptrend alongside the price breakout, accompanied by a surge in volume (confirmed by the volume bars). This confluence of signals strengthens your conviction in the bullish move, increasing your confidence to enter a long trade.
Scenario 2: Spotting a Potential Bearish Reversal
You’ve been monitoring a stock that’s been enjoying a strong uptrend. However, you notice a divergence developing between the price and the PVO. Price continues to make new highs, but the PVO starts to form lower highs. This bearish divergence suggests a weakening uptrend and a potential reversal on the horizon. You decide to exit your long position (if you’re currently holding) or consider initiating a short position to capitalize on the potential downside move.
How to Trade with Percentage Volume Oscillator Indicator
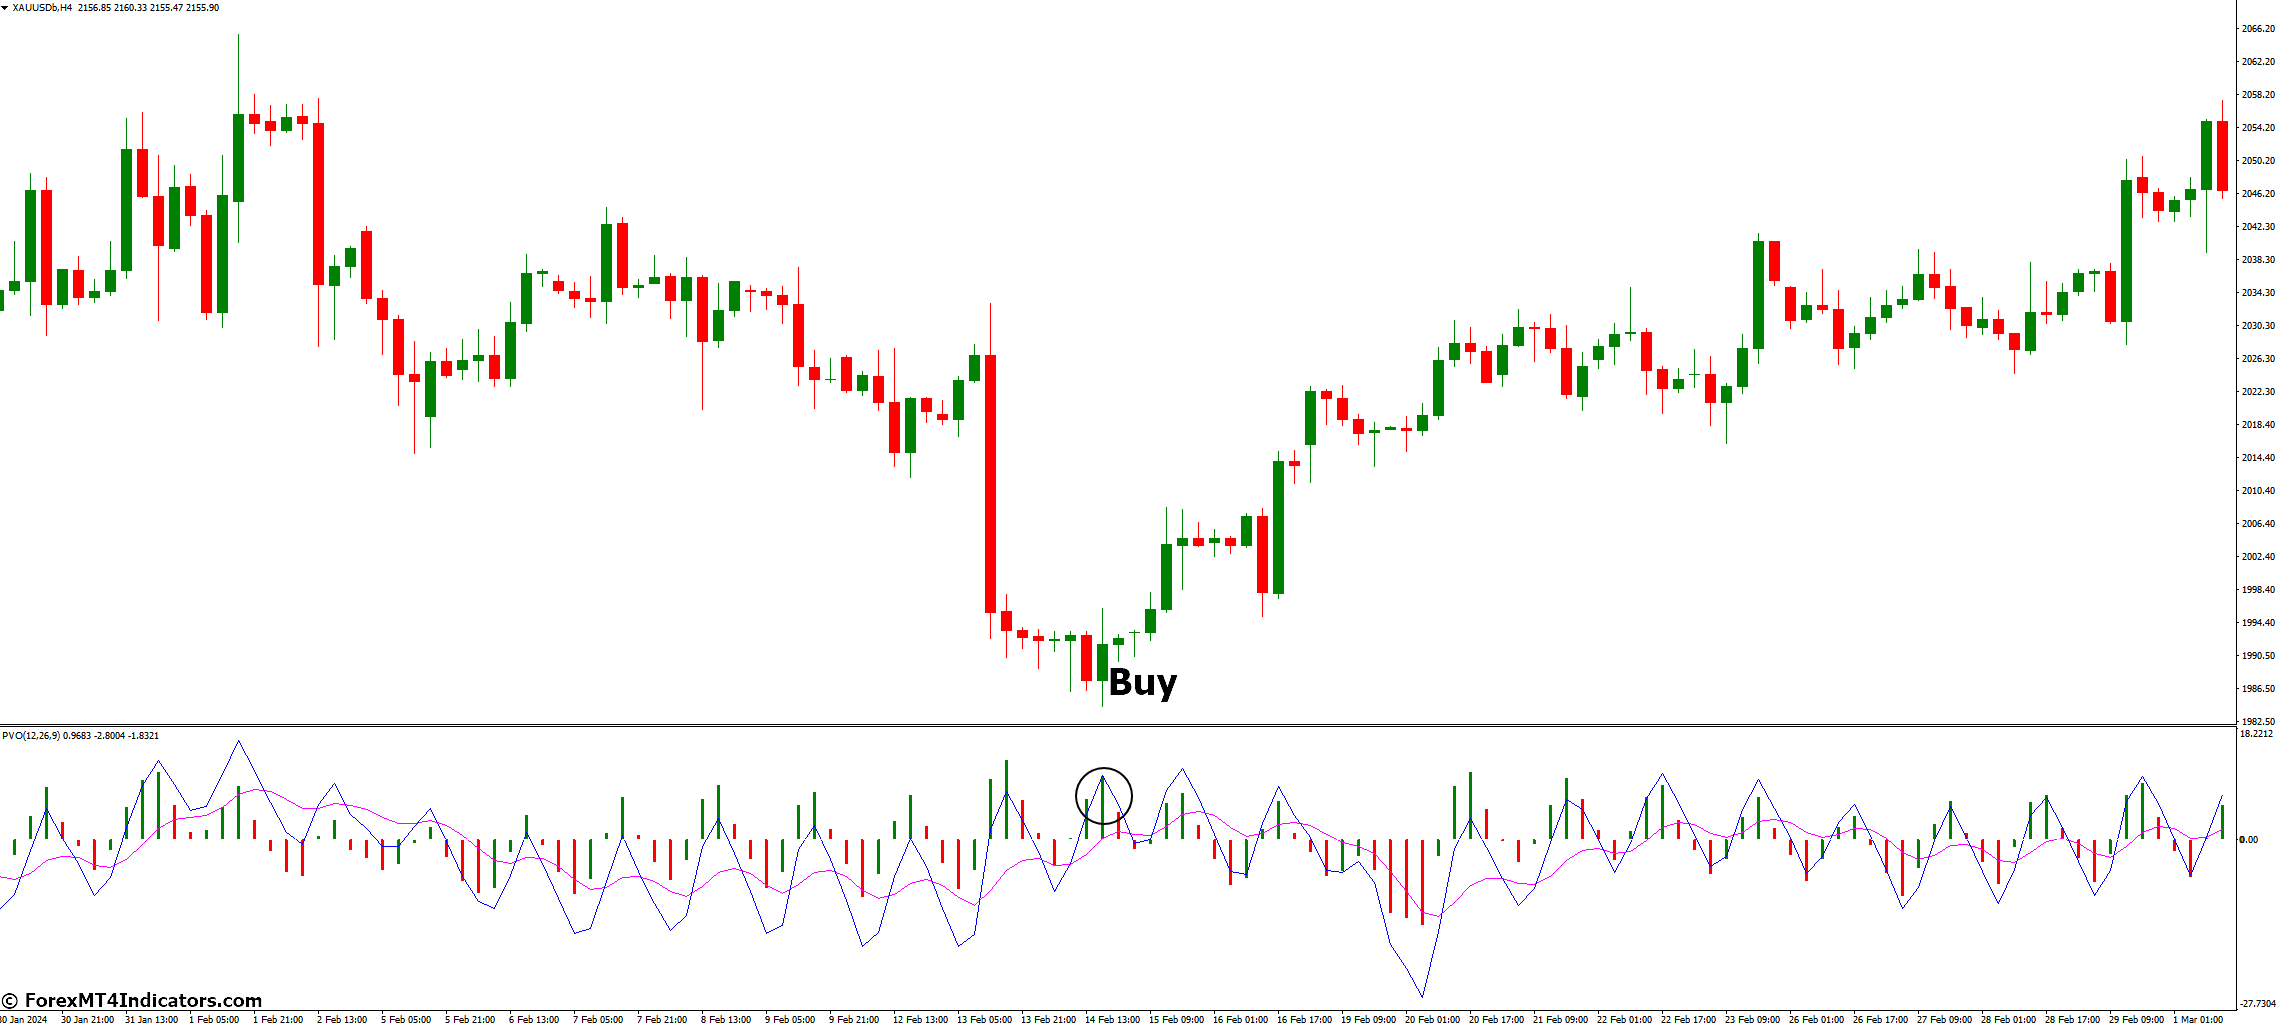
Buy Entry
- Price: Look for a breakout above a key resistance level (e.g., trendline, horizontal resistance).
- PVO: Confirmation comes from a rising PVO trending above the centerline and accompanied by increasing volume (confirmed by volume bars).
- Stop-Loss: Place your stop-loss order below the breakout level or a recent swing low, whichever is more conservative.
- Take-Profit: Consider profit targets based on technical levels like Fibonacci retracements or a projected price move based on historical volatility.
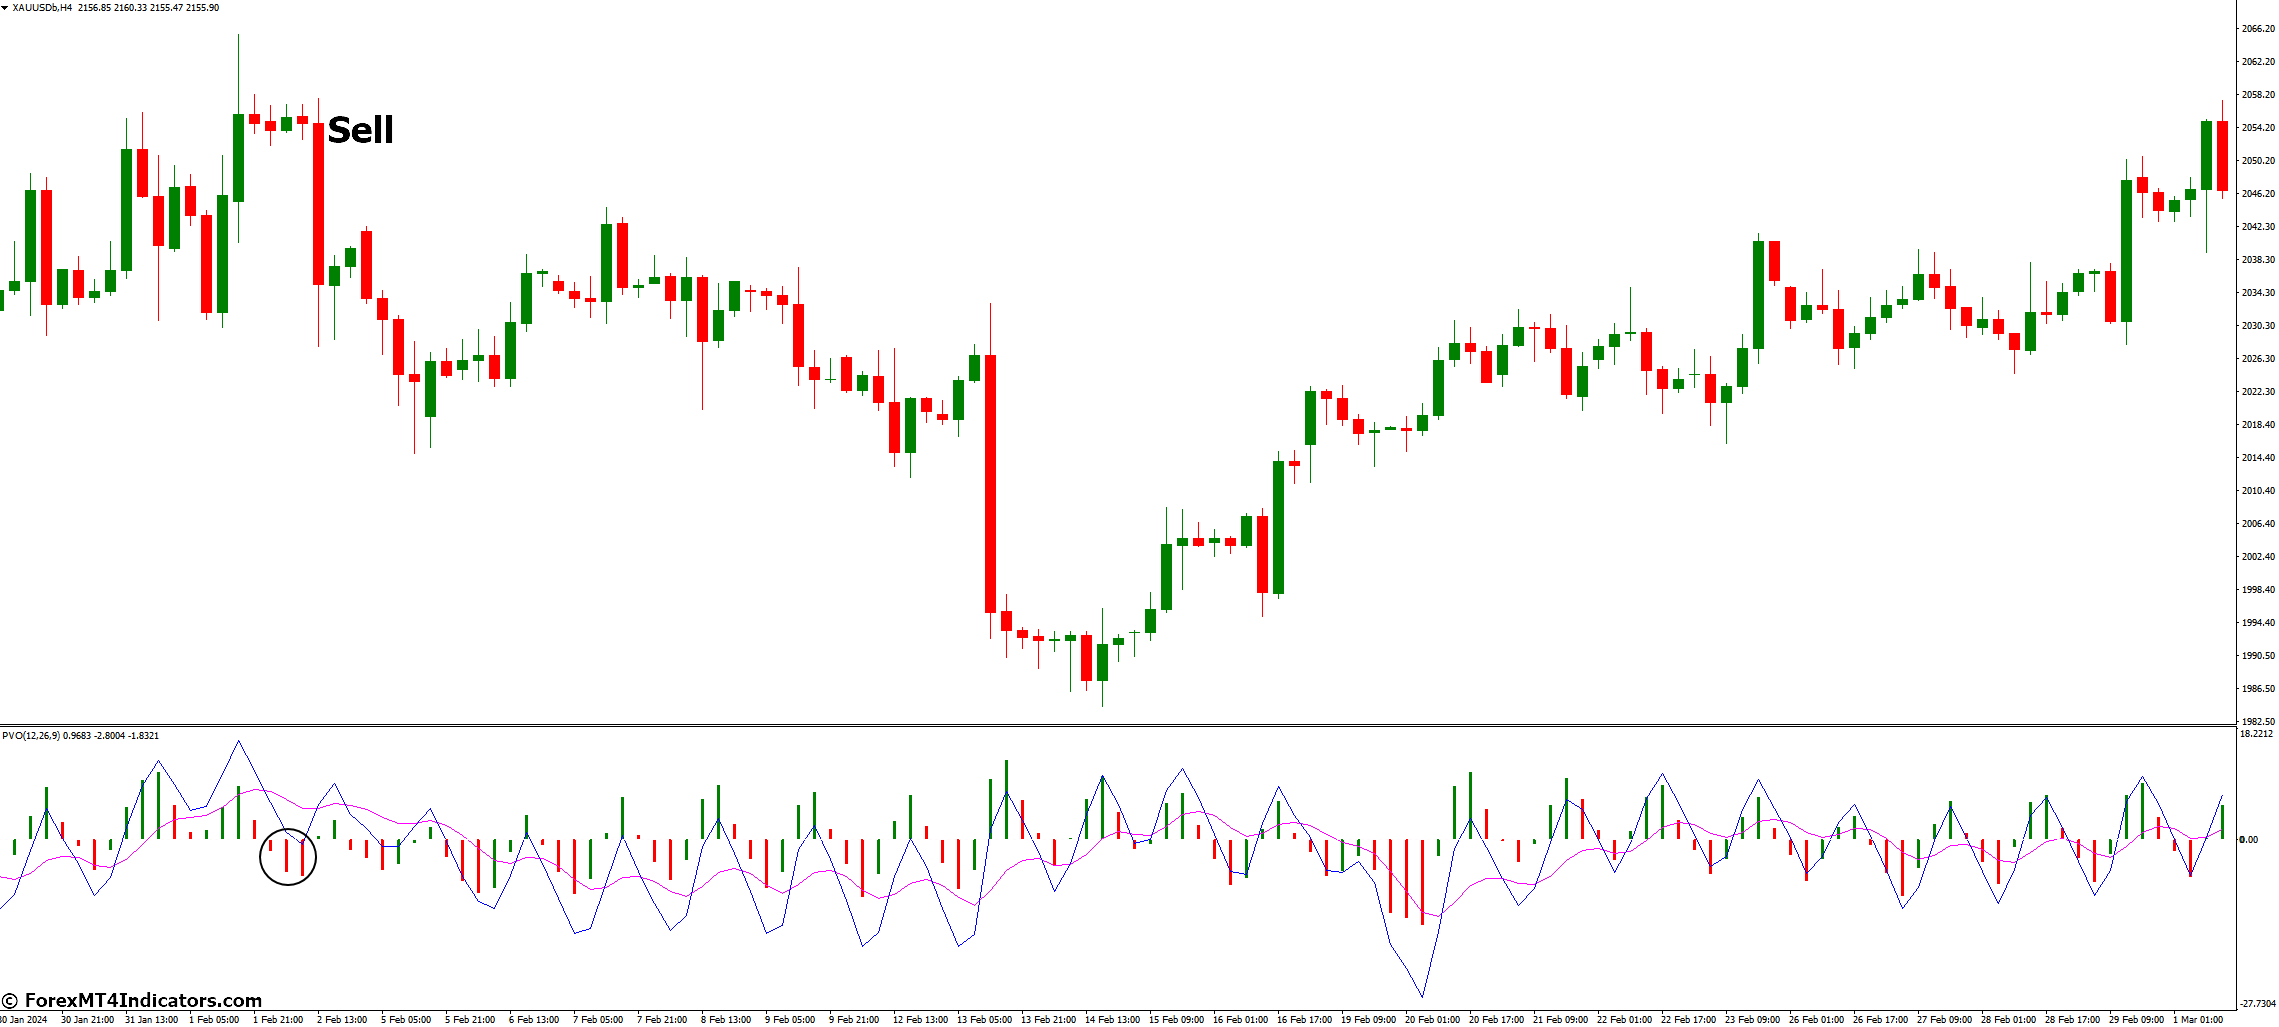
Sell Entry
- Price: Identify a potential reversal signal like a bearish engulfing candlestick or a price rejection at a resistance zone.
- PVO: Look for bearish divergence – the price makes new highs while the PVO forms lower highs. Decreasing volume on the price uptick (visible on volume bars) strengthens the signal.
- Stop-Loss: Set your stop-loss above the recent swing high or the breakout level if it’s a false breakout, whichever provides a reasonable buffer.
- Take-Profit: Target potential downside moves based on support levels or by using measured move techniques based on the recent price swing.
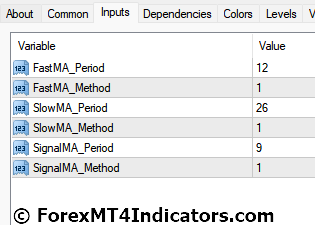
Percentage Volume Oscillator Indicator Settings
Conclusion
The Percentage Volume Oscillator has emerged as a valuable tool for traders seeking to incorporate volume analysis into their strategies. Its ability to translate volume data into a user-friendly format empowers you to gauge market strength, identify trends, and potentially spot potential reversals. While the PVO isn’t a magic bullet, it can be a powerful ally in your trading arsenal when used thoughtfully and in conjunction with other technical analysis tools.
Recommended MT4/MT5 Brokers
XM Broker
- Free $50 To Start Trading Instantly! (Withdraw-able Profit)
- Deposit Bonus up to $5,000
- Unlimited Loyalty Program
- Award Winning Forex Broker
- Additional Exclusive Bonuses Throughout The Year
>> Sign Up for XM Broker Account here <<
FBS Broker
- Trade 100 Bonus: Free $100 to kickstart your trading journey!
- 100% Deposit Bonus: Double your deposit up to $10,000 and trade with enhanced capital.
- Leverage up to 1:3000: Maximizing potential profits with one of the highest leverage options available.
- ‘Best Customer Service Broker Asia’ Award: Recognized excellence in customer support and service.
- Seasonal Promotions: Enjoy a variety of exclusive bonuses and promotional offers all year round.
>> Sign Up for FBS Broker Account here <<
(Free MT4 Indicators Download)
Click here below to download:
Recent Posts
Categories
Related Articles
How To Predict Forex Price Movements Accurately
Struggling to predict forex price movements? The foreign exchange market trades over...
ByglobalreutersJanuary 19, 2025A technical view of the major currency pairs going into the new trading week
EURUSD:USDJPY:GBPUSD:USDCHF:USDCAD:AUDUSD:NZDUSD: This article was written by Greg Michalowski at www.forexlive.com.
ByglobalreutersJanuary 18, 2025Greenland, Canada and the Panama Canal: What is the real plan here?
Here is my base case.Greenland:This is a real pet project of Trump's....
ByglobalreutersJanuary 18, 2025Trend Continuation Factor and Hurst Exponent Forex Trading Strategy
The Trend Continuation Factor and Hurst Exponent Forex trading strategy is a...
ByglobalreutersJanuary 18, 2025


Leave a comment