


Polkadot Price Sets Sights on New Highs: DOT Bullish Momentum Building

Polkadot (DOT) is consolidating gains above the $7.40 zone against the US Dollar. The price could start another increase if it clears the $7.70 resistance.
- DOT gained pace and tested the $7.70 resistance level against the US Dollar.
- The price is trading above the $7.20 zone and the 100-hourly simple moving average.
- There is a key bullish trend line forming with support at $7.40 on the hourly chart of the DOT/USD pair (data source from Kraken).
- The pair could continue to rise if it fails to stay above the $7.20 support.
Polkadot Price Holds Support
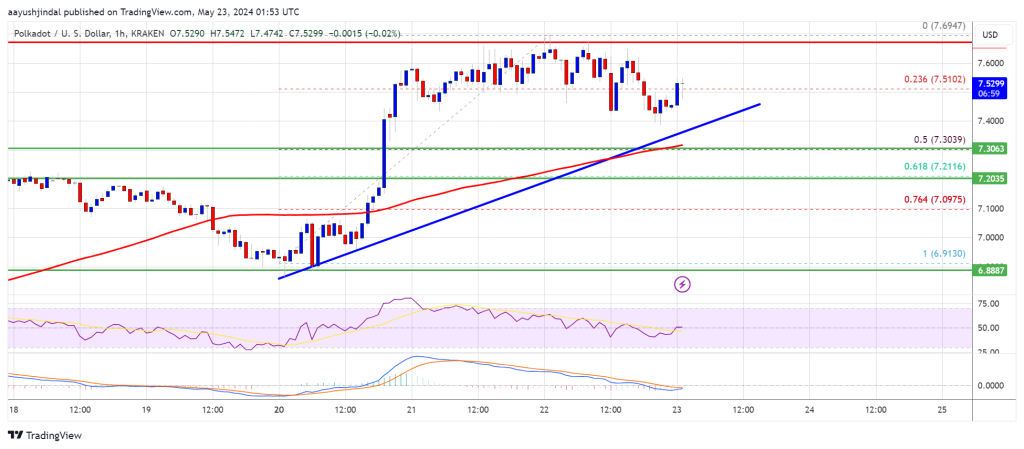
After forming a base above the $6.80 level, DOT price started a decent increase. It broke many hurdles near $7.20 and even spiked above $7.65. A high was formed at $7.69 and the price is now consolidating gains, like Ethereum and Bitcoin.
There was a move below the $7.50 support zone. The price declined below the 23.6% Fib retracement level of the upward move from the $6.91 swing low to the $7.69 high.
DOT is now trading above the $7.20 zone and the 100 simple moving average (4 hours). There is also a key bullish trend line forming with support at $7.40 on the hourly chart of the DOT/USD pair. Immediate resistance is near the $7.70 level.
The next major resistance is near $7.80. A successful break above $7.80 could start another strong rally. In the stated case, the price could easily rally toward $8.20 in the near term. The next major resistance is seen near the $8.50 zone.
More Downsides in DOT?
If DOT price fails to start a fresh increase above $7.70, it could continue to move down. The first key support is near the $7.40 level and the trend line.
The next major support is near the $7.30 and the 100 simple moving average (4 hours) or the 50% Fib retracement level of the upward move from the $6.91 swing low to the $7.69 high, below which the price might decline to $7.00. Any more losses may perhaps open the doors for a move toward the $6.90 support zone or $6.80.
Technical Indicators
Hourly MACD – The MACD for DOT/USD is now gaining momentum in the bullish zone.
Hourly RSI (Relative Strength Index) – The RSI for DOT/USD is now above the 50 level.
Major Support Levels – $7.40, $7.30 and $7.10.
Major Resistance Levels – $7.70, $7.80, and $8.20.

Related Articles

BRICS Unmoved by Trump’s 100% Tariff Threats, Says Russian Envoy
BRICS, an economic bloc comprising emerging nations, remains unfazed by U.S. President...

Solana (SOL) Ignites New Momentum: Bulls Target Higher Ground
Solana started a fresh increase above the $240 resistance. SOL price is...
President Trump frees Ross Ulbricht, slamming his life sentence as a ‘Ridiculous’ injustice
President Trump has granted a full pardon to Ross Ulbricht, the founder...

Crypto Madness: REXShares And Osprey File For TRUMP, BONK, And DOGE ETFs
Amid the fervor generated by the latest launches of President Donald Trump...
Leave a comment